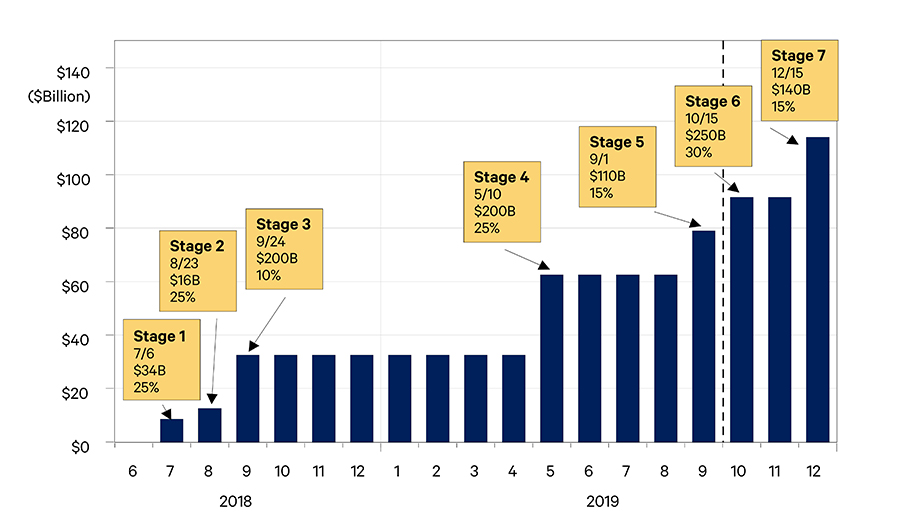
On September 1, 2019, when the U.S. imposed 15% tariffs on a new list of Chinese imports with a value of around $110 billion, the U.S./China trade dispute became more of a full-blown trade war. If, as in previous negotiations, the upcoming October negotiation fails, it is expected that China will face another increase on imports currently subject to tariffs of from 25% to 30%. In addition, on December 15, the remaining Chinese exports to the U.S. (about $140 billion) are scheduled to be subject to a 15% tariff. Consequently, absent an agreement between the two countries, by the end of 2019, almost all U.S. imports of goods from China will have tariffs of either 15% or 30%. Figure 1 lists the estimated annualized tariff revenues, assuming no reduction in Chinese exports to the U.S., based on those tariff rates1. Clearly China will respond with additional tariffs on U.S. goods and additional non-tariff costs for U.S. companies doing business in China.
Up to this point both countries have dug their heels in, and while negotiations continue, the two are far apart. To come to an agreement, at least one country needs to compromise. We do not see either willing to do so at this point. The U.S. President has said in public comments that he cannot accept a 50-50 compromise deal because he believes that China has benefited, fairly or not, much more than the U.S. in U.S.-China trade over the past several decades. In other words, for the U.S., China needs to agree and compromise more. The Chinese government has repeatedly stated through the various media it controls that it will not accept such an “unequal treaty.” Notice the language that they use. This is a reference to the period from 1840 to 1949, a period that ended with the victory of the Communist Party in the Chinese Civil War, which is described in Chinese textbooks as the “Century of Humiliation.” Thus, we are pessimistic with regard to a near term end to the current trade war.
The Trade War Deepens
If the two largest economies in the world cannot make a deal in the near future, what are the implications for 2020?
Although both countries are experiencing slower economic growth, the U.S. has yet to see significantly higher consumer prices in response to the tariffs, and China has yet to see financial market meltdown in response to its currency depreciation, nor significant unemployment with the cut-back in some of the export oriented manufacturing sectors. Indeed, Chinese industrial production grew by over 4% this past year.
Consequently we ask: if the two largest economies in the world cannot make a deal in the near future, what are the implications for 2020? If, as we suspect, the trade war will be with U.S. for some time, then look for trade patterns to change. Economic analysis of past trade disputes and tariff barriers suggest that the U.S. will be purchasing more, higher priced goods from other countries and that U.S. supply chains will diversify if not completely change. China will continue, indeed intensify, its pivot towards South and South East Asia for trade in goods and towards European companies for foreign investment. The longer the trade war goes on, the more costly it will be to recover the previous, more efficient trading patterns.
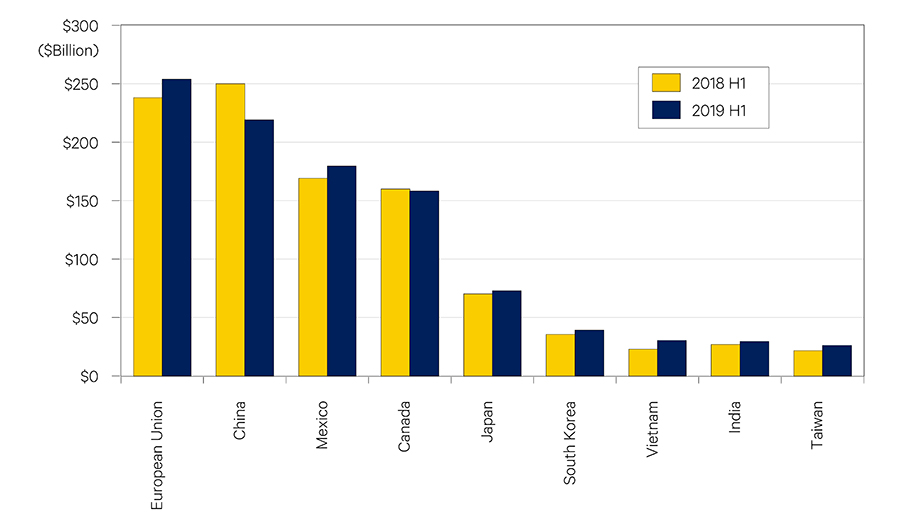
The direct consequence of the trade war between the U.S. and China can be seen in Figure 2, which displays the major exporters to the U.S. for the first six months of 2018 and 2019. While most U.S. imports from other parts of the world have continued to increase, there was a significant decline of U.S. imports from China of about $30 billion. The EU has now replaced China as the largest trading exporter to the U.S.
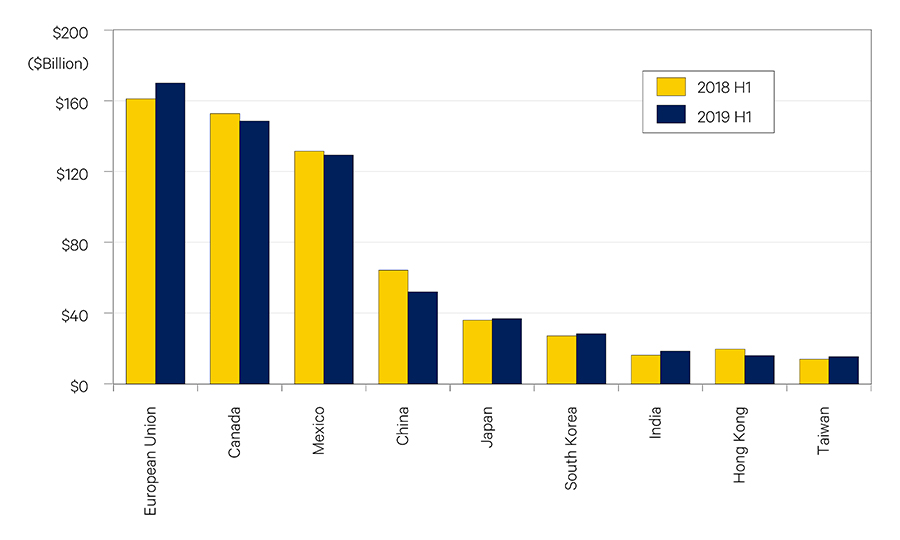
Figure 3 presents the major trading partners of the U.S. by exports. While China is the fourth largest country for U.S. exports, it has seen the largest decline ($12 billion) followed by Canada’s of -$4.2 billion, Hong Kong of -$3.6 billion, and Mexico of -$2.2 billion. In short, the trade war with China and the strong dollar have hurt U.S. exports. It should be noted that many U.S. exports to China are inputs to Chinese products that are then sold in the U.S. (e.g. Apple iPhones). Also, there is at least some evidence that exports from other countries, particularly Cambodia, Thailand and Vietnam, to the U.S. have significant Chinese manufacturing content, and though the trade diversion is real, the actual impact on the Chinese economy may be less than meets the eye.
Is there a risk of losing all of the U.S. market for Chinese exports? Given the supply chains that have built up over the last 20 years, the expertise existent in China, and the infrastructure in China which is absent elsewhere, the answer is no. However the trade war will diminish trade between the two countries from what it otherwise would have been. Chinese policy is to mitigate this loss by replacing that part of the U.S. market with increased trade with countries in Asia, Africa, and Europe. This is the ambitious “One Belt One Road” initiative, conceived long before the U.S. election of 2016.
Will this come true in the near term? Figure 4 shows the seasonally adjusted monthly Chinese exports and imports with the rest of the world since the year 2000. The blue line is export value and the red line is import value. It is clear that Chinese export growth has been remained stable (or stagnant) over the past two years. Given the slowdown in world economic growth, particularly in Europe, it is difficult to find countries with sufficient purchasing power to supplant much of China’s exports to the U.S.
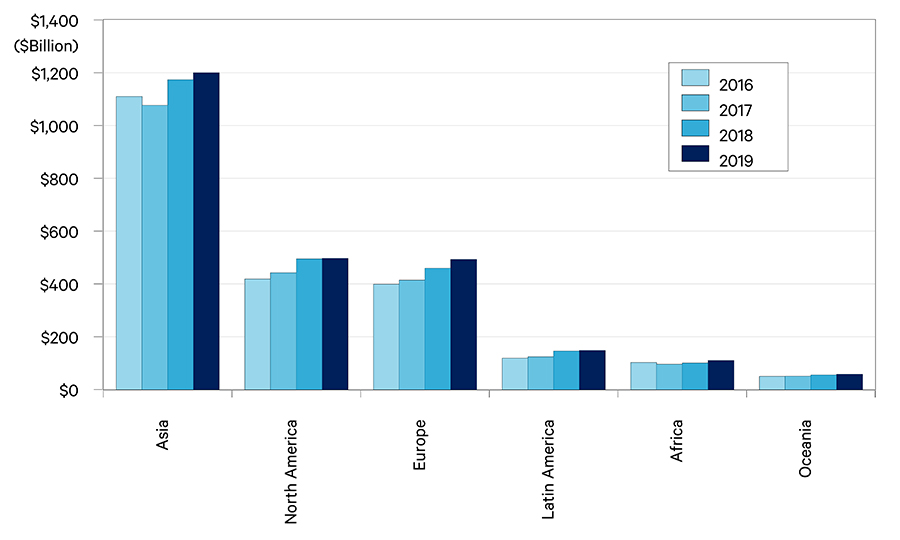
Figure 5 exhibits the value of China’s exports to six continents over the past four years2. The largest market for Chinese exports is Asia, which accounts for 48% of all exports, about $1.2 trillion. The second largest market is North America, which accounts for 20% of all exports, valued at $496 billion, followed by Europe at 20% ($492 billion), Latin America at 6% ($148 billion), Africa at 4% ($109 billion), and Oceania at 2% ($58 billion). It appears that Asia is the most important market for China, and that North America is not that important with its much smaller fraction of total Chinese exports.
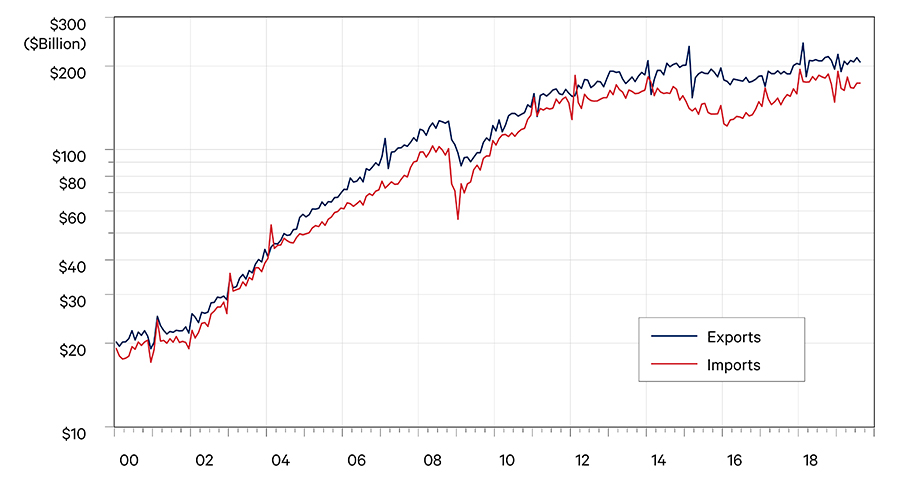
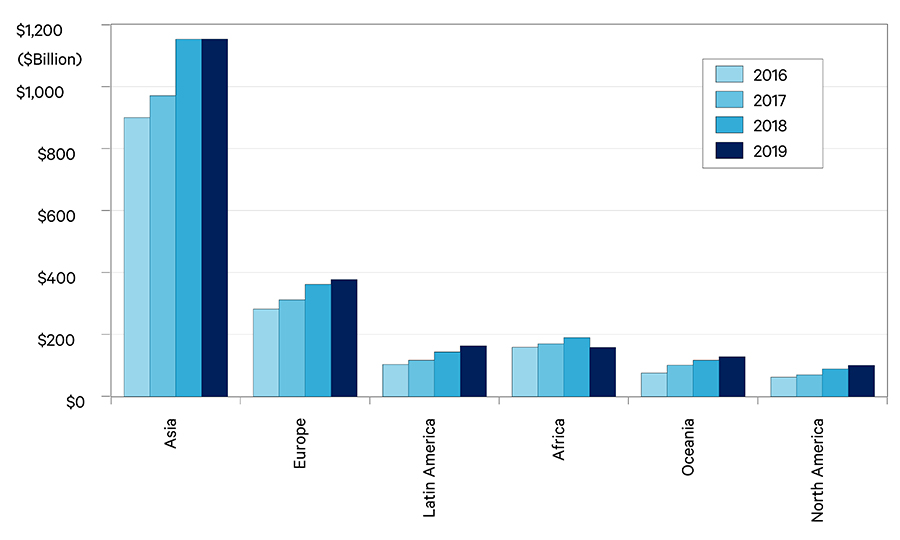
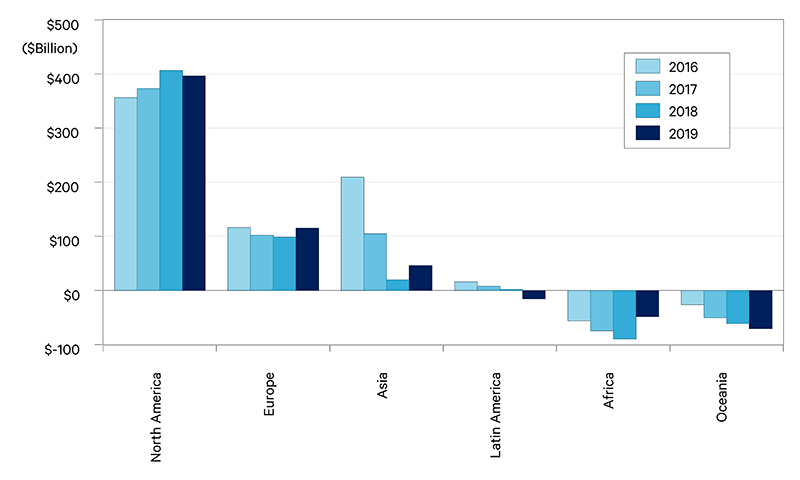
Figure 6 exhibits China’s imports from the six continents between 2016 and 2019. In 2019, Asia is the largest source of its imports, valued at $1.2 trillion, followed by Europe at $377 billion, Latin America at $163 billion, Africa at $157 billion, Oceania at $128 billion, and North America at $99 billion. Based on exports and imports, we calculate China’s trade balance for these six regions (Figure 7), which reveals a stunning picture! The majority of Chinese trade surplus come from North America (mostly the U.S.) with $396 billion in 2019 accounting for 94% of the surplus.
The implication of these data are twofold. First, don’t look to rapid changes in trade patterns over the next twelve months. China will not be able to simply substitute South Asia for the U.S. market. Similarly, U.S. supply chains and U.S. consumers will not be able to shift to other country suppliers quickly. China’s huge trade with the U.S. as illustrated in the previous charts engendered a very large and efficient supporting infrastructure. Seven of the top ten busiest container ports in the world are serving China. There are two other ports in Asia, Singapore and Busan, neither of which are situated to support South and South East Asia production of goods for the U.S.. In addition to ports, roads and railroads, a trained workforce, and a government structure to support hundreds of billions of dollars worth of exports is required. It took China from 1978 to present to build these; an effort that was mandated through Chinese industrial policy.
Although the trade war has intensified between the U.S. and China, it is not too late to prevent further escalation or even to deescalate it. However, in addition to the aforementioned issues, the conflict and competition between two countries, particularly with respect to technologically sophisticated goods, make it more complex to resolve. A case in point is Huawei. It is worth noting many in both political parties in the U.S. think President Trump is too soft on Huawei, and therefore at least some restrictions on trade with an international brand important for the Chinese will remain.
Have the two countries backed themselves into corners that are hard to get out of? It seems that way at the moment. Since the U.S. has adopted a go-it-alone policy, there does not appear to be a third party with the diplomatic savvy to pull a rabbit out of the hat here. Since the Chinese have framed the trade war in terms of U.S. imperialism, and as an opportunity for China to lead the world, there does not appear to be any counterbalance to provide an innovative solution there. We will closely watch events unfold over the balance of the year, but if as we expect neither side is willing to make significant concessions, look to higher prices and the beginning of changing trade patterns in 2020.
Cathay Bank has established a sponsorship relationship with UCLA Anderson Forecast to produce a U.S.-China Economic Report. In this report, UCLA Anderson Forecast will talk about their view of economic analysis and perspective on the current and future outlook relating to the two largest economies in the world – the United States and China.
UCLA Anderson Forecast has been the leading independent economic forecast of both the U.S. and California economies for over 65 years. The annual report and quarterly columns written by UCLA Anderson Forecast will focus on current topics affecting investment flows and associated economic events between China and the United States.
This report includes forecasts, projections and other predictive statements that represent UCLA Anderson Forecast’s economic analysis and perspective on the current state and future outlook of the economies of The United States and China in light of currently available information. These forecasts are based on industry trends and other factors, and they involve risks, variables and uncertainties. This information is given in summary form and does not purport to be complete. Information in this report should not be considered as advice or a recommendation to you or your business in relation to taking a particular course of action and does not take into account your particular business objectives, financial situation or needs.
Readers are cautioned not to place undue reliance on the forward-looking statements in this report. UCLA Anderson Forecast does not undertake any obligation to publicly release the result of any revisions to these forward-looking statements to reflect the occurrence of unanticipated events or circumstances after the date of this report. While due care has been used in the preparation of forecast information, actual results may vary in a materially positive or negative manner. Forecasts and hypothetical examples are subject to uncertainty and contingencies outside UCLA Anderson Forecast’s control.
Jerry Nickelsburg joined the UCLA’s Anderson School of Management and The Anderson Forecast in 2006. Since 2017 he has been the Director of The Anderson Forecast. He teaches economics in the MBA program with a focus on Business Forecasting and on Asian economies. He has a Ph.D. in economics from the University of Minnesota and studied at The Virginia Military Institute and George Washington University. He is widely published and cited on issues related to economics and public policy.
William Yu joined the UCLA Anderson Forecast in 2011 as an economist. At Forecast he focuses on the economic modeling, forecasting and Los Angeles economy. He also conducts research and forecast on China’s economy, and its relationship with the US economy. His research interests include a wide range of economic and financial issues, such as time series econometrics, data analytics, stock, bond, real estate, and commodity price dynamics, human capital, and innovation.