
The U.S. job market showed signs of cooling with the addition of only 89,000 and 142,000 payroll jobs in July and August, respectively. This fueled concerns about the course of the economy and future interest rates. On September 18, the Federal Reserve cut the federal funds rate by 0.5%. Chairperson Powell explained that inflation is now on a sustainable path back to the 2% target and the labor market has cooled considerably. To meet the Fed's dual mandate of maximum employment and stable prices, the Fed has initiated an aggressive rate cut at the beginning of this easing cycle. The previously restrictive monetary policy, aimed at reducing inflation over the past three years, is shifting to a more normalized stance.
The Chinese economic landscape has not improved since the last U.S.-China economic report. With continued softness in residential construction, investment, and local government finance, China’s stimulative policies and potential impacts are now more uncertain. The pronouncements following the Third Plenum of Congress did not clarify changes, if any, to macroeconomic policy. The open question is: can China reinvigorate its growth amidst numerous economic challenges?
This report will delve into key questions for 2024/2025: How substantial will the U.S. interest rate cuts be in the future? Can the U.S. effectively manage inflation and stave off a recession? Will China begin robust growth once more and if so, what will the economic drivers be?
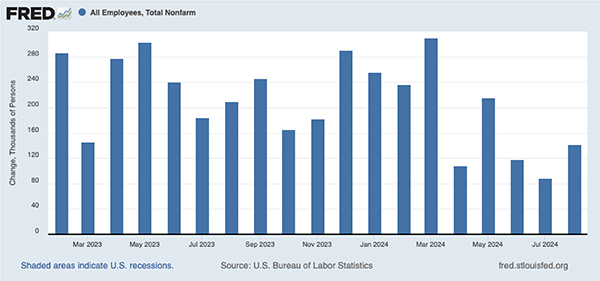
As predicted in previous reports, U.S. economic growth is slowing down due to high interest rates, full employment, and physical capacity constraints. Figure 1 illustrates the monthly change in payroll jobs, a key concurrent indicator for the U.S. economy. The data reveals that monthly payroll job growth has averaged 150,000 since April 2024, down from an average of 240,000 per month before April. Additionally, the Bureau of Labor Statistics recently announced a preliminary estimate for the upcoming annual benchmark revision to the nonfarm payroll number, indicating 816,000 fewer payroll jobs as of March 2024. This represents a 0.5% benchmark adjustment, significantly higher than the 0.1% average over the past decade. In other words, payroll job growth is even weaker than previously reported.
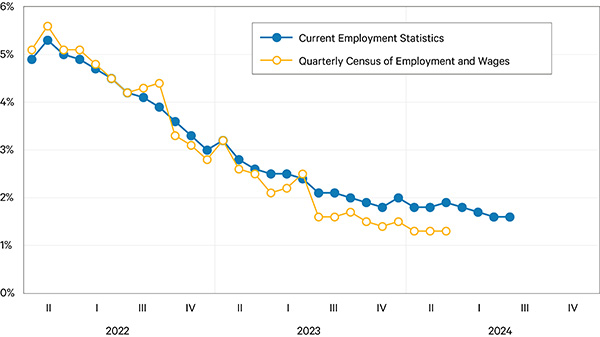
Let's take a closer look at the payroll job statistics. Figure 2 shows year-over-year monthly growth in payroll jobs from two sources. The blue line represents data from the Current Employment Survey (CES), which is based on reports from 119,000 businesses and government agencies with 629,000 establishments, covering about 5% of all establishments and 30% of all nonfarm payroll employees in the nation. This survey is particularly important because it is released monthly and provides timely updates on the economy. However, it is also subject to frequent revisions and an annual benchmark revision due to its nature as a sampling survey. The orange line represents data from the Quarterly Census of Employment and Wages (QCEW), which is based on all Unemployment Insurance tax accounts, covering 11.3 million establishments. As the term 'census' suggests, this source provides much broader and more accurate coverage than the CES. In fact, the QCEW serves as the basis for the annual CES benchmark revision. We can see that the growth rate of jobs reported by the CES has slowed over the past year. However, the growth rate of jobs reported by the QCEW has slowed even more significantly since July 2023, which aligns with the BLS’s recent preliminary revision.
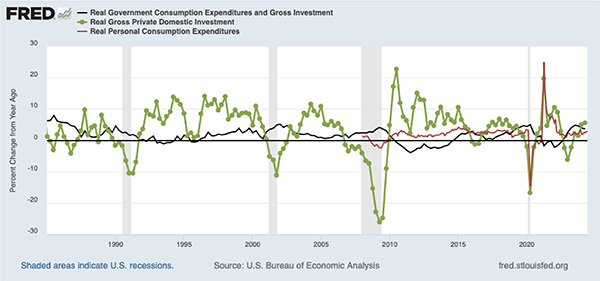
Despite the softening labor market, why do we still forecast a no-recession outlook? As discussed in previous reports, three main factors have helped the U.S. economy withstand the challenges posed by disinflationary rate hikes over the past three years. The first is the continuation of expansionary fiscal policies, illustrated by the black line in Figure 3, which shows the year-over-year growth of real government spending. The second is a sustained boom in private investment, which is revitalizing U.S. manufacturing and establishing AI infrastructure, as indicated by the green line. It is crucial to note that private investment is often a key driver of the business cycle. The red line represents steady growth in real personal consumption, which has continued despite rising prices. With all three major GDP components showing positive growth, there appears to be no immediate threat of a recession.
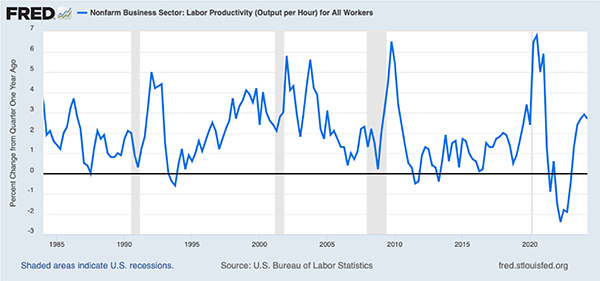
The third is that we are seeing robust labor productivity growth, as shown in Figure 4. This indicates that with the same labor input, we are producing more output, which ultimately leads to higher income and increased consumption. As a result, a virtuous cycle of economic expansion is likely to persist. With inflation stabilizing, we suggest the Federal Reserve is correct in responding to market pressure for the long-awaited interest rate cuts in September.
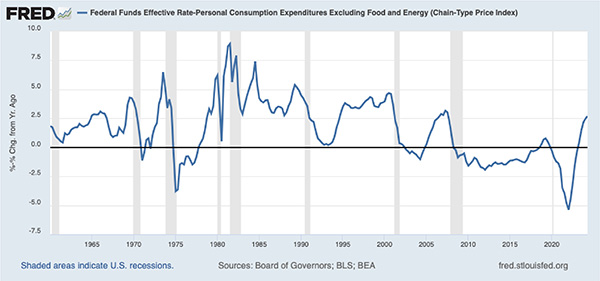
Now the question arises: What extent of rate cuts can we expect over the next two years? Many investors on Wall Street are nostalgic for the low interest rates experienced over the past two decades. However, we suggest a return to those levels is unlikely. Figure 5 displays a simple ex-post short-term real interest rate, which is the federal funds rate minus the year-over-year core PCE (personal consumption expenditures) inflation rate. This real rate effectively represents the true cost of borrowing for consumption and investment. When it is very low or negative, it can easily lead to overinvestment, asset bubbles, overconsumption, and inflation. Historical data illustrates this: negative rates in the 1970s were associated with the Great Inflation era. In the early 2000s, these rates contributed to inflation and housing bubbles. During the 2010s, negative rates did not trigger inflation but led to an escalation in housing prices to less affordable levels. And in the early 2020s, the repercussions were evident to us all.
The historical average of real short-term rates was around 1.5%. Based on The Federal Open Market Committee’s (FOMC) Summary of Economic Projections in June 2024, a median forecast for core PCE inflation of 2.3% and a Federal Funds Rate of 4.1% in 2025, implies a real rate of 1.8%. If inflation were to decrease to the target rate of 2%, a reasonable Federal Funds Rate would be in the range of 3.5%. For a more detailed analysis of the U.S. economy, readers can refer to the article published for the Anderson Forecast Economic Outlook Conference in Fall 2024.
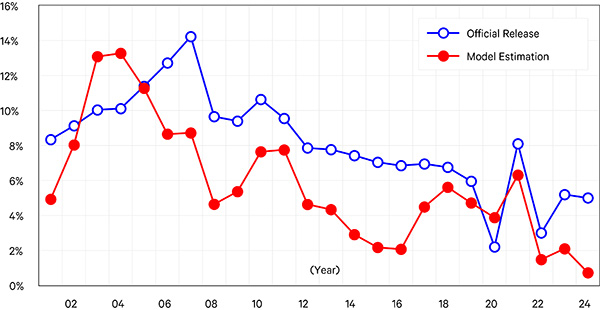
Despite widespread observations of weak consumer demand, rising unemployment, falling wages, and a significant downturn in residential investment in China this year, the Chinese government reported a 5% GDP growth for the first half of 2024. This figure starkly contrasts with prevailing perceptions and raises questions about the accuracy of China's official statistics. Typically, a Western economy displaying such negative indicators would likely be in a recession. To provide an alternative perspective, the UCLA Anderson Forecast has developed a model to assess China’s GDP growth more realistically. This model considers the year-over-year growth rates of four key indicators from the first six months of 2023 to 2024: estimated energy consumption at 4.2%, CO2 emissions at 0.3%, total trade (exports and imports combined) at 1.4%, and home price growth at -30%. According to this model, China’s GDP growth rate for the first half of 2024 is estimated to be just 0.7%, significantly lower than the official estimate, and essentially indistinguishable from zero when considering the margin of forecast error.
Figure 6 shows a comparison between our model’s estimates of China’s historical GDP (red line) and the official figures from the National Bureau of Statistics (NBS) (blue line). It is clear that our estimates consistently show lower growth rates than those officially reported. We have used a -30% estimation for Chinese home prices to reflect the implicit bursting of the property bubble. Measures enacted by the government have slowed the fall in housing prices as measured in official statistics. Our estimate is of the implied free-market price decline. Over the last three years, there has been a consecutive decline in China's real estate investment: a drop of 5% in 2022, 14% in 2023, and 10% in the first half of 2024. The floor space of completed residential construction also contracted by 22% in the first half of 2024, returning to levels last seen in 2010. Similarly, the floor space of buildings sold decreased by 19% during the same period, reverting to levels from 2014. Typically, the collapse of a real estate bubble triggers a prolonged and severe recession due to the sharp decline in asset prices, which destabilizes the financial positions of households, corporations, and local governments. This compels significant reductions in consumption and investment as these entities strive to repay their debts over time.
As noted in previous reports, a core issue with the Chinese economy is significant imbalances including fixed-asset investment which accounted for 42% of GDP in 2023, only slightly down from 43% in 2021. This is a result of years of consistent overinvestment. By contrast, household consumption was only 39% of GDP, markedly lower than that of other major economies worldwide. As detailed in the following section, Beijing continues to prioritize policies that promote investment and production over those that boost household consumption. Chinese consumers, concerned about the state of the economy, have increased savings rates over the last year adding to demand insufficiency within the domestic economy. Without efforts to gradually enhance Chinese consumers’ spending through increased household disposable income and greater household long-term income security, we remain pessimistic about China’s economic prospects in both the near and long term.
With a slump in real estate investment, one might wonder which sectors are sustaining China's high investment levels. As depicted in Figure 7, while fixed-asset investment growth in the tertiary (service) industry (including real estate, public transportation infrastructure including railways and highways, and utility management) has stalled, investment in the secondary industry (encompassing mining, manufacturing, and power generation) has remained strong, even increasing in 2024.
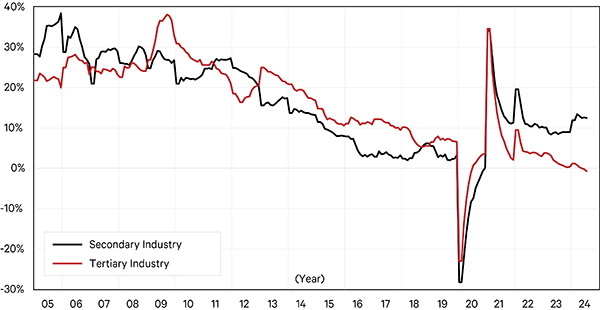
Figure 8 details the growth rates across the main sectors within these industries. Notably, the real estate sector (red line) has seen negative growth over the last three years. Conversely, investment in the manufacturing sector (black line), which includes key areas like the semiconductor industry—deemed strategically vital for technology and national security in light of U.S. policy restrictions—has remained high, exceeding most periods from 2015 to 2019. Moreover, investment in the power generation sector (blue line), covering electricity, gas, and water, has surged to over 20% in recent years to support a low-cost energy supply for manufacturing. Additionally, investment in transportation infrastructure (green line) has continued to see double-digit growth, despite many projects incurring significant losses and maintenance challenges. It is crucial to underscore that this level of investment, paralleling that seen in the real estate sector, is unsustainable.
It is clear that Chinese consumers alone are not willing to absorb all the Chinese products manufactured in their current economic climate. Consequently, China is compelled to export its surplus goods to international markets. Figure 9 illustrates China’s monthly nominal goods exports, seasonally adjusted, to the rest of the world, highlighting a recovery in Chinese exports and trade surplus over the past few months.
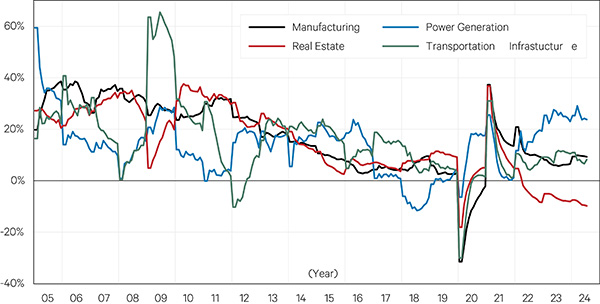
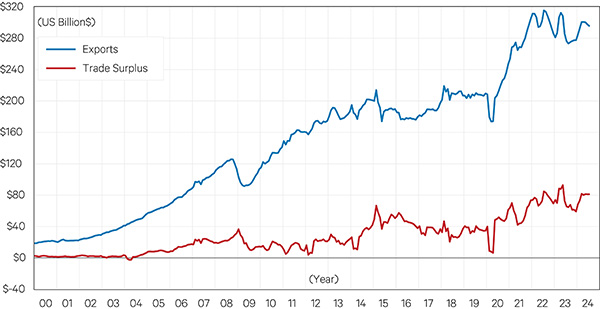
Figure 10 details the growth rates of China’s goods export values for major products during the first seven months from 2019 to 2024. In this period, China's total export goods increased by 44% in value. Notably, vehicle products experienced significant growth, reflecting the extremely competitive pricing of Chinese electric vehicles. In response, in 2024, the U.S. and Canada imposed a 100% tariff on Chinese EVs and other key components of the EV supply chain, a sharp increase from the previous 25%. Additionally, the European Union introduced provisional import tariffs on Chinese EVs, ranging from 27.4% to 48.1%, following an anti-subsidy investigation in 2024.
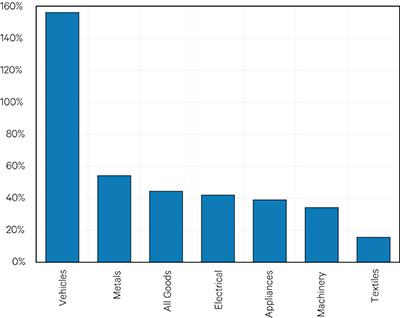
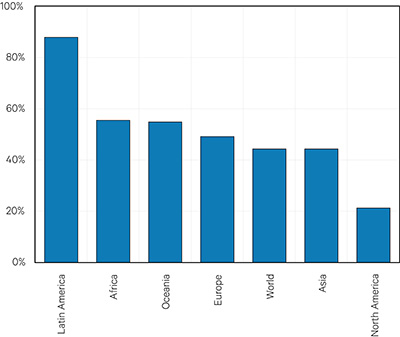
Figure 11 tracks the growth rates of China’s goods export values by destination regions for the first seven months from 2019 to 2024. In response to U.S. tariffs and trade restrictions that began in 2018, China has strategically diversified its export markets. Noteworthy increases include an 88% rise in exports to Latin America, a 56% increase to Africa, a 55% rise in Oceania, and a 49% increase to Europe, which includes a significant 131% surge to Russia. Additionally, exports to Asia grew by 44%, with a notable 71% increase to ASEAN countries, while North America saw a 21% increase. This strategic capacity exporting and diversification suggests the potential for increased trade tensions with countries beyond the U.S. and E.U. in the future. China’s mercantilist ideology, which is closely linked to its internal economic imbalance, also plays a crucial role in causing global trade imbalances and challenges.
The current report on U.S. / China economic relations echoes our previous reports. The U.S. economy is growing and though China is a significant part of U.S. trade, the exposure to trade restrictions as a percent of GDP remains relatively small. China’s economy is experiencing weak demand and policies to keep investing in a negative rate of return infrastructure and induced exports only postpone the restructuring necessary for sustained long-term growth. The expectation is for increased U.S. and E.U. restrictions on trade with China. The net result will be weak to negative growth in imports to the U.S. and fewer opportunities for investment in and exports to China in the near term.
Cathay Bank has commissioned UCLA Anderson Forecast to produce a U.S.-China Economic Report series that focuses on current topics affecting investment flows and associated economic events between China and the United States.
UCLA Anderson Forecast has been the leading independent economic forecast of both the U.S. and California economies for 70 years.
This report includes forecasts, projections, and other predictive statements that represent UCLA Anderson Forecast’s economic analysis and perspective on the current state and future outlook of the United States and China economies based on the available information. These forecasts take into account industry trends and other factors and involve risks, variables, and uncertainties. This information is given in summary form and does not purport to be complete. Information contained in this report should not be considered advice or recommendation for a particular course of action and does not take into account any particular business objectives, financial situation, or needs.
Readers are cautioned not to place undue reliance on the forward-looking statements. UCLA Anderson Forecast does not undertake any obligation to publicly release the result of any revisions to these forward-looking statements after the date of this report. While due care has been used in the preparation of the forecast information, actual results may vary in a materially positive or negative way. Forecasts and hypothetical examples are subject to uncertainty and contingencies beyond the control of UCLA Anderson Forecast.
Jerry Nickelsburg joined UCLA’s Anderson School of Management and The Anderson Forecast in 2006. Since 2017 he has been the Director of The Anderson Forecast. He teaches economics in the MBA program with a focus on Business Forecasting and Asian economies. He has a Ph.D. in economics from the University of Minnesota and studied at The Virginia Military Institute and George Washington University. He is widely published and cited on economics and public policy.
William Yu joined the UCLA Anderson Forecast in 2011 as an economist. He focuses on economic modeling, forecasting, and the Los Angeles economy. He also researches and forecasts on China’s economy and its relationship with the U.S. economy. His research interests include various economic and financial issues, such as time series econometrics, data analytics, stock, bond, real estate, commodity price dynamics, human capital, and innovation.

