| 下载此报告 | |
| 回看讲座中文版视频 |
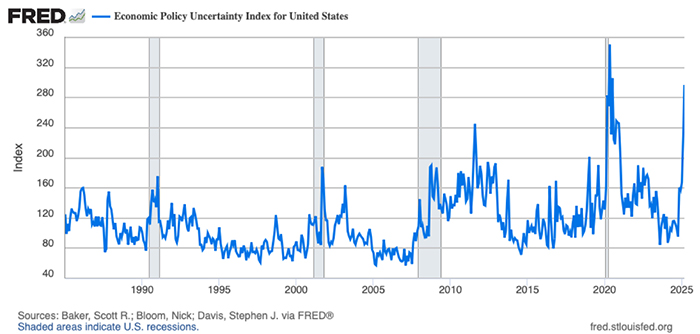
There’s a saying: “There are decades where nothing happens, and there are weeks where decades happen.” The first ten weeks of the second Trump administration have been weeks of major changes — chief among them, a profound shift in U.S. trade policy. In just three months, the U.S. has implemented several sweeping rounds of tariffs: 25% tariffs on global steel and aluminum imports, 25% tariffs on automobiles and auto parts, reciprocal tariffs on all the trading partners with tariff rates ranging from 10% to 49%, and an astounding 145% tariff on all Chinese imports. The scale and speed of these measures are unprecedented over a century. Economic uncertainty has surged to levels not seen since the peak of the COVID-19 pandemic, reflected by the monthly economic uncertainty index (Figure 1). This is both a function of the mercurial changes in policies, changes which can and have been undone at a moment’s notice, and because there exists little data to analyze all of these changes happening simultaneously. Unsurprisingly, stock markets and consumer sentiment reacted negatively. This report examines the potential consequences of this paradigm shift in U.S. trade policy.
Since China joined the WTO in 2001, it has become the world’s leading manufacturer and exporter — flooding global markets with competitively priced products ranging from shoes and toys to solar panels and computers. This phenomenon, often referred to as “China Shock 1.0,” contributed to the closure of factories in advanced economies and the loss of middle-class manufacturing jobs. In recent years, China has climbed the value chain, becoming the world’s largest producer of electric vehicles and batteries. Now, it is seeking to export its industrial overcapacity — a development some call “China Shock 2.0.” With China facing weak domestic demand, a real estate crisis, and mounting debt, the question arises: will this new China Shock stabilize its economy, or trigger a new wave of global trade protectionism in an era of rapidly changing U.S. economic policy? This report will explore these questions in depth.
Our forecast, in a nutshell, is that the U.S. economy will slow down in 2025 and 2026 amid heightened tariffs, deportations uncertainty, and federal spending cuts. Over time, however, factors such as deregulation, AI-driven investment and productivity gains, increased foreign investment, reshoring, and tax cuts are expected to support stronger growth by 2027. For a more comprehensive analysis of the U.S. economic outlook, please refer to our colleague Clement Bohr’s recent article, “A Tariffic Amount of Uncertainty1.” Given the numerous policy changes and persistent uncertainty, the Anderson Forecast also released a recession watch2. If the economic impact of the Trump administration's policies were to be felt all at once, the risk of a recession would be significant.
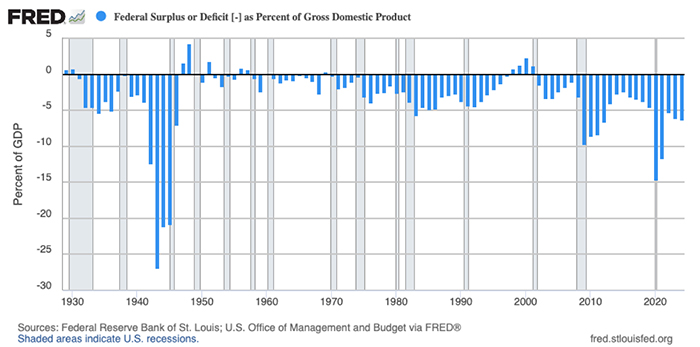
Figure 2 shows the federal budget deficit as a percentage of GDP. Aside from the pandemic-driven spikes in 2020 and 2021, federal deficits have been steadily increasing — from 2.4% of GDP in 2015 to 6.3% in 2024. A 6.3% deficit (roughly $2 trillion) is widely seen as unsustainable. This provides the context for the creation of the Department of Government Efficiency (DOGE). Over the past few decades, there have been two notable bipartisan efforts to rein in large deficits — either through spending cuts, tax increases, welfare reform, or a combination of all. The first occurred in the early 1990s when the deficit reached 4.5% of GDP in 1992. With cooperation between the Clinton administration and a Republican-led Congress, alongside a strong economy, the federal budget was balanced within four years. The second effort took place in the early 2010s after the deficit peaked at 8.6% of GDP in 2010. However, this time, the goal of a balanced budget was never achieved, and deficits began to rise again.
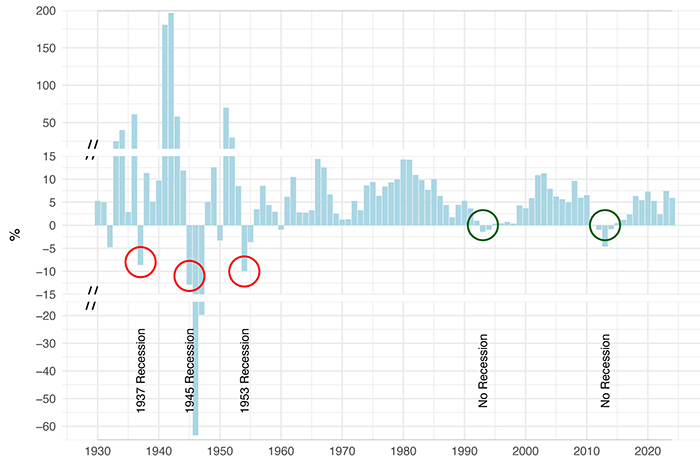
The Trump administration has proposed eliminating the $2 trillion deficit by cutting federal spending by $1 trillion and increasing revenue by another $1 trillion. The key question is: how will this be achieved? If the full spending cut is implemented within a single year — and assuming a fiscal multiplier of one — it would equate to a direct reduction of 15% in the federal budget, or about 3.4% of GDP. This level of contraction could likely trigger a recession. An alternative proposal from the House of Representatives involves reducing taxes by $4.5 trillion over 10 years while cutting spending by at least $1.5 trillion over the same period, or about $150 billion per year. Figure 3 shows the annual growth rate of nominal federal government expenditures and investments, excluding major social programs such as Medicare, Medicaid, and Social Security. Most analyses suggest that meeting the proposed spending reduction targets would likely require significant cuts to at least one of the major entitlement programs — Medicare or Medicaid.
Since 1930, there have been five major episodes of federal spending cuts: 1937, 1945–47, 1953/54, 1993/94, and 2011–2014. The 1937 cut (federal expenditure growth in 1937: -8.6%) contributed partly to the 1937 recession. The cuts in 1945-47 (e.g. -63% in 1946) and 1953 (-10%) were due to the end of World War II and the Korean War, and were the primary causes of the 1945 and 1953 recessions. However, the cuts in 1993/94 and 2011–2014 did not lead to recessions. Why? Because they were more gradual and moderate in scale. The key historical lesson is: If federal spending reductions are implemented gradually and with moderation over several years, say $300 billion (1% of GDP) a year, the likelihood of triggering a recession decreases significantly.
Note that when the Federal Reserve began raising interest rates in March 2022 as it tightened monetary policy to fight against high inflation, many feared a recession — especially given the prolonged and significant inversion of the yield curve. However, three years later, a recession has not materialized. One key reason is the use of expansionary fiscal policy, which helped offset the economic drag from rising interest rates. This support, however, came at the cost of widening federal budget deficits as shown in Figures 2 and 3.
Another part of the effort to balance the federal budget involves raising revenue by $1 trillion. One proposal is to issue a “gold card” — an advanced green card—to attract wealthy foreigners to obtain permanent resident status by contributing $5 million to the U.S. government. For example, if 20,000 foreigners were to participate in this program, the federal government would instantly raise $100 billion. Of course, there would need to be 20,000 per year to make this more than a one-time event. Another proposed measure is tariffs, which will be discussed in the next section.
On April 2, the Trump administration announced sweeping global tariffs3 on imports to the U.S. from all trading partners, starting at a base rate of 10%. In addition, a special formula is applied: the ratio of a country’s trade surplus with the U.S. to the value of its goods exports to the U.S. is calculated, and half of that ratio becomes the special tariff rate — if it exceeds 10%. Based on trade surplus rankings, the resulting reciprocal tariff rates are as follows: China at 34%, European Union at 20%, Vietnam 46%, Taiwan 32%, Japan 24%, South Korea 25%, India 26%, Thailand 36%, Switzerland 31%, Malaysia 24%, Indonesia 32%, Cambodia 49%, and South Africa 30%.
Note that Canada and Mexico are not included in this list, as tariffs on their exports are governed by earlier executive orders. Their tariff structures are more complex. Under the USMCA, exports from Canada and Mexico that qualify under the agreement are exempt from tariffs4. For example, in 2024, the U.S. imported $505 billion in goods from Mexico, of which approximately $180 billion were exempt from tariffs due to USMCA qualifications. This includes most of the $181 billion in auto and auto parts, which are also USMCA-compliant. As of now, the U.S.-origin content in a USMCA-qualifying vehicle is exempt from any tariffs, and qualifying auto parts are likewise exempt. From Canada, the U.S. imported $413 billion in goods in 2024, of which $107 billion were USMCA-qualifying and exempt from tariffs.
Additional measures are as follows. On March 3, a 20% tariff was imposed on all Chinese imports as a response to synthetic opioid shipments to North America5. With the 34% reciprocal tariff, Chinese goods faced a combined 54% tariff. On May 2, the U.S. will impose a 90% tariff on low-value packages (under $800) from China and Hong Kong, ending duty-free de-minimis treatment. In 2024, approximately 1.36 billion parcels were imported this way, totaling an estimated $66 billion in value.6 On March 12, a 25% tariff was implemented on imported steel and aluminum products, including derivatives, from all countries.7 On April 3, a 25% global tariff on cars and auto parts took effect.8
Figure 4 presents the top 15 trading partners’ import values to the U.S. in 2024, along with the estimated tariff revenues based on the tariff rates announced or implemented under Trump 2.0’s original plan. These numbers are based on the heroic assumption that the U.S. imports the same amounts as in 2024. Estimated tariff revenue from China would be approximately $237 billion, followed by the European Union with $121 billion, Mexico with $81 billion (based on an estimated average effective tariff rate of 16%), Vietnam with $63 billion, Taiwan with $37 billion, Japan with $36 billion, South Korea with $33 billion, and Canada (estimated average effective tariff rate of 14%) with $58 billion. Based on these figures, the average effective tariff rate across all trading partners is calculated to be approximately 25%, leading to a total potential tariff revenue of $819 billion.
However, certain imported products are currently exempt from reciprocal tariffs — such as pharmaceuticals, semiconductors, copper, lumber, critical minerals, and energy products — amounting to roughly $600 billion in imports based on our estimates. As a result, about $150 billion should be deducted from the total potential revenue, bringing the maximum likely tariff revenue to around $668 billion (20% of all the goods imports). Since tariffs increase prices and consumers lower consumption of higher priced goods, actual tariff revenue would likely be lower than this estimate. Additionally, the tariff formula aims to reduce trade deficits; if successful, revenues would decline further.
On April 9, after briefly implementing steep reciprocal tariffs for several hours, the U.S. temporarily paused them for 90 days and reduced them to a 10% base tariff rate. During this period, many countries are expected to enter negotiations with the U.S., seeking to lower these reciprocal tariffs by adjusting their trade policies — such as by reducing their own tariffs, increasing imports of U.S. goods, or easing non-tariff barriers. Nonetheless, we anticipate that the 10% base tariff rate for all trading partners will remain in effect after the 90-day window. We also expect that the 25% tariffs on automobiles and steel/aluminum will be long-lasting, as the Trump administration considers these industries critical to national security.
In response to U.S. tariffs on April 2, China retaliated with a 34% tariff on American imports. The U.S. countered with an additional 50% tariff on Chinese goods, bringing the effective rate to 104%. A day later, China raised its tariffs on U.S. imports to 84%. As of April 9, the U.S. has increased tariffs on all Chinese goods to 145%. With tariff rates this high, U.S. imports from — and exports to — China will almost certainly decline sharply. A significant portion of U.S. imports from China is likely to be redirected to other countries. Following the COVID-19 pandemic, this marks another critical moment to test the resilience of global supply chains in the coming months.

This sweeping tariff shock is expected to have several profound impacts. First, how much tariff revenue are we actually collecting on all imports? It's difficult to estimate how much the U.S. will import from China under the steep 145% tariff rate. Assuming the U.S. offsets Chinese imports by sourcing equivalent amounts from the rest of the world — and applying all current tariffs, including 25% on autos and steel/aluminum, and a 10% reciprocal tariff on all trading partners with all current exemptions — the total tariff revenue could reach $320 billion. This would help reduce the federal budget deficit. All else being equal, Treasury yields would likely decline9 as the U.S. federal government would have less need to borrow. Lower borrowing demand would reduce the crowding-out effect and interest rates, potentially boosting private borrowing and investment.
But who would actually pay for this $320 billion in tariffs? Foreign producers/exporters, U.S. importers/retailers, or American consumers? Recent economic studies on the Trump 1.0’s tariffs suggest that U.S. importers and consumers bear most of the burden10. If we assume that U.S. companies and retailers absorb one-third of the tariffs by cutting their profit margins, and consumers pay the remaining two-thirds, this would translate into $213 billion in additional household spending. Given that U.S. personal consumption expenditures totaled $20 trillion in 2024, this implies a 1.1% increase in the overall price level. The final prices consumers face would depend on the price elasticity of demand for these imported goods, as well as the degree of competition and availability of substitutes. If demand is inelastic, consumers will bear more of the cost. If substitutes are readily available, or if there’s strong competition, the burden on consumers and the level of imports will be lower.
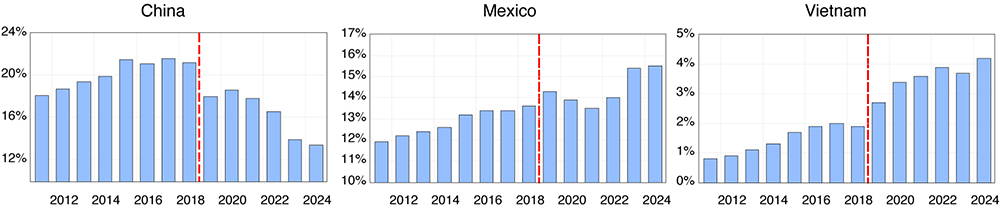
Figure 5 illustrates the shares of U.S. goods imports from China, Mexico, and Vietnam. In response to the Trump 1.0 tariffs on China, the share of U.S. goods imported from China declined from 22% in 2017 to 13% in 2024. At the same time, global supply chains adjusted, shifting production to countries not subject to tariffs. That said, consumers are unlikely to bear the full cost of tariffs indefinitely. Under a potential global tariff regime — where tariffs are determined by a country’s trade surplus with the U.S. — American importers may find it increasingly risky to rely on low-tariff countries. After 90 days or even a year, a review of bilateral trade balances could trigger a new round of reciprocal tariffs on countries with large surpluses. In such a scenario, the only zone with guaranteed tariff-free status would be the U.S. itself. This environment would likely encourage some degree of reshoring and a resurgence in U.S. manufacturing. However, the time required to initiate, build, and open a factory is typically 3 to 6 years. Therefore, the reshoring, were it to occur, would not increase U.S. manufacturing until at least 2028.
An important question is whether American importers and corporations can afford to absorb some of the tariff costs or reshore production to the higher-cost American homeland. In 2024, U.S. corporate profits after tax reached $3.6 trillion. Figure 6 shows U.S. corporate profits after tax as a share of GDP. Profit margins have been on an upward trend since 2000, reaching 11% in 2024 compared to 8% in 1997 — possibly due to globalization and a less competitive domestic market. These high margins suggest that some businesses may be able to absorb a portion of the tariff costs. Recent declines in stock market valuations may reflect their reducing profit margins.

In summary, the prices of imported goods are expected to rise, leading American consumers to reduce their purchases. U.S. retailers and companies will face lower profit margins, and foreign exporters will experience declining revenues. The U.S. economy is likely to grow at a slower pace, global trade will decelerate, and trade deficits may or may not narrow. An additional source of uncertainty and risk lies in the potential for retaliatory actions from trading partners, which could further escalate the trade war. Thus far, the primary retaliation has come from China, which imposed an 84% tariff on all U.S. exports to China — valued at $244 billion in 2024. If the trade war intensifies, the likelihood of a recession will increase. Financial markets have already reacted sharply and negatively. The VIX Volatility Index surged to 52 on April 8 — a level previously seen only during the 2008 global financial crisis, and the 2020 COVID-19 pandemic. Oil prices fell to $59 per barrel, reflecting widespread concerns about an abrupt departure from the era of free trade and globalization that has prevailed since World War II.
On a positive note, nonfarm payrolls in March rose by 228,000, exceeding most forecasts. The unemployment rate stands at 4.2%, and initial jobless claims remain stable. CPI inflation declined during the month. In February, both the industrial production index and construction spending showed continued strength. Although the economic foundation during the first two months of the Trump administration appears resilient, it is crucial to monitor how conditions evolve and how both the U.S. and China respond to the changing trade landscape.
Over the coming years, we will see new investments in the U.S.: the $500 billion Stargate Project, focused on AI infrastructure, involving OpenAI, SoftBank, and Oracle; Taiwan Semiconductor Manufacturing Company (TSMC) pledging $100 billion to build five new chip factories; Apple committing $500 billion to expand its domestic manufacturing and research operations; and Hyundai investing $21 billion in vehicle, battery, and steel production, etc. These capital investments and their resulting output are expected to boost U.S. GDP and create more manufacturing jobs in the long run.
As noted in the previous section, China has been the hardest-hit country by the tariff wave unleashed under Trump 2.0. With a 145% in tariffs imposed over the past three months, the high tariff blow is particularly damaging to China’s already weakened economy. If tariffs are not reduced in the near future, Chinese exports to the U.S. are expected to plummet. In response, China has vowed to “fight to the end,” as both sides remain entrenched in an intensifying trade conflict. Given this escalating trade war between the world’s two largest economies, it is difficult to envision any meaningful improvement in U.S.-China relations in the near term. Note that during Trump 1.0, there were instances of transshipment, where some Chinese goods were rerouted through third countries with favorable trade terms, had their country-of-origin labels changed, and were then shipped to the U.S. tariff-free. Discussions on monitoring and prohibiting such transshipment practices will be part of the focus during the upcoming 90-day negotiation period between the U.S. and its trading partners.
Since the bursting of its real estate bubble in 2022, China has been undergoing a painful deleveraging process — characterized by declining consumption and reduced investment — typical of a balance sheet recession. As a result, domestic demand remains weak. In an effort to avoid a full-blown recession, China has been stimulating its economy by promoting investment in manufacturing and technology. The goal is to climb the value chain and strengthen its technological capabilities. A major breakthrough came in early 2025 with the launch of DeepSeek, an AI product that shocked the world and demonstrated China’s competitiveness in one of the most critical sectors — artificial intelligence — rivaling the U.S.
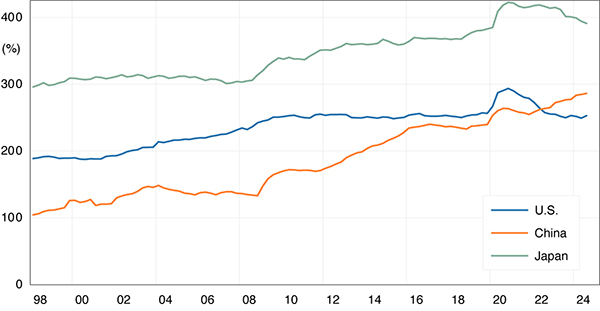
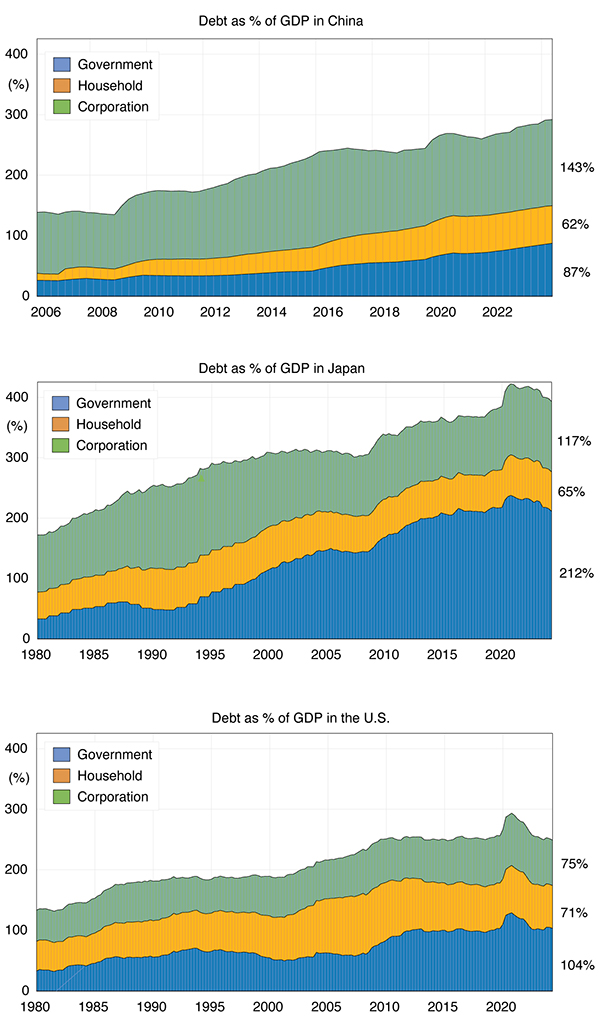
However, this progress comes at a cost, as much of the government support has resulted in failures, money loss, and excess capacity. Figure 7 shows the total debt-to-GDP ratio — including government, corporate, and household debt — for China, the U.S., and Japan. It is clear that under China’s state-driven investment strategy, debt levels have risen rapidly, recently surpassing those of the U.S., while the debt ratios in the U.S. and Japan have remained relatively stable since the COVID-19 period. Figure 8 presents a breakdown of the debt-to-GDP ratio for the three countries. There are growing concerns that, following the burst of its real estate bubble, China may now be inflating a new bubble in the manufacturing sector. Looking at historical precedents, Japan experienced a similar pattern after its 1980s bubble: the corporate sector deleveraged while the government significantly increased its debt. In the U.S., following the 2007 housing crisis, the government also stepped in by increasing borrowing to support household deleveraging. We expect China may follow a similar path — shifting the debt burden to the government to allow the corporate and household sectors to gradually deleverage.
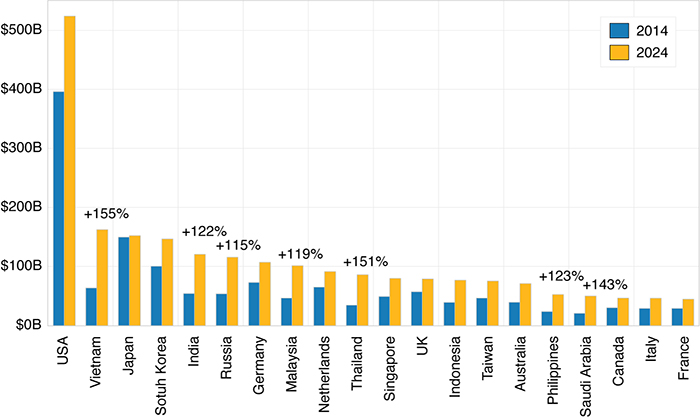
As China continues allocating its resources toward investment and manufacturing, it is working hard to export its overcapacity to the global market to offset weak domestic demand. Some have referred to this as “China Shock 2.0.” Well before Trump’s tariff wave in April 2025, the U.S., Canada, and the E.U. had imposed anti-dumping tariffs on Chinese electric vehicle exports. Yet, many Chinese goods continue to flood global markets with highly competitive prices. Figure 9 illustrates the top 20 destinations for China’s exports in 2014 and 2024. The United States remains the largest destination, followed by Vietnam, Japan, South Korea, and India. Among these trading partners, over the past decade, China’s exports to: Vietnam increased by 155%, India by 122%, Russia by 115%, Malaysia by 119%, Thailand by 151%, Philippines by 123%, and Saudi Arabia by 143%.
China’s exports to the U.S. are expected to decline significantly under the pressure of high tariff rates. In effect, “Trump Shock 2.0” has as its purpose to largely offset the impact of “China Shock 2.0” on U.S. manufacturing. Nevertheless, China is likely to continue expanding its exports to other regions — assuming those countries do not introduce new measures to protect domestic industries or address trade imbalances. Figure 10 provides a broader perspective. In 2014, China’s exports to Asia exceeded its imports from the region by 10%. The trade surplus with Europe stood at 31%, with North America (the U.S. and Canada) at 131%, and with Latin America at 7%. By 2024, China’s trade surplus had increased across all these regions: Asia by 26%, Europe by 51%, North America by 171%, and Latin America by 15%.
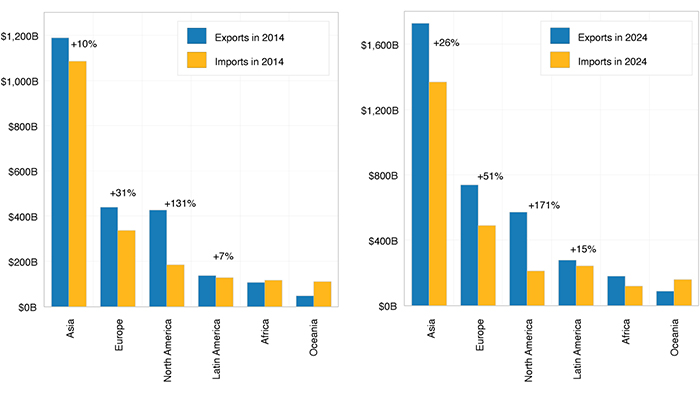
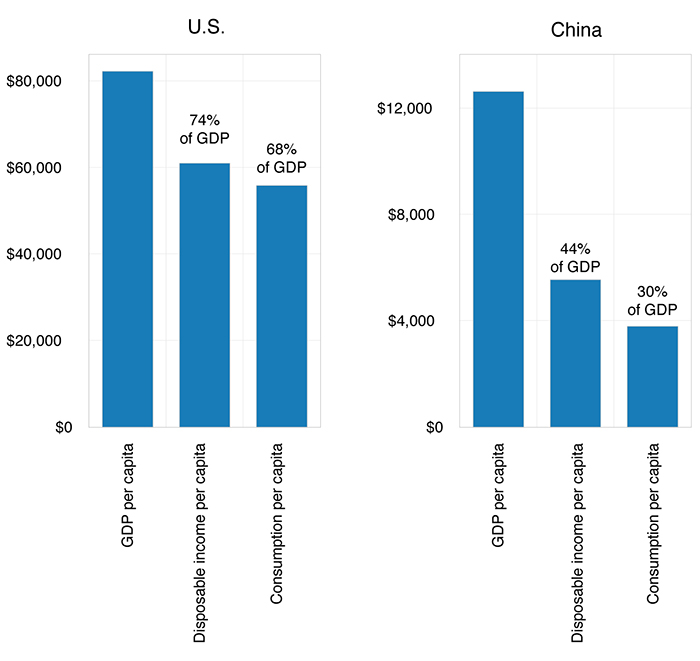
Figure 11 compares per-capita GDP, disposable income, and consumption in the U.S. and China in 2023. While the United States has a significantly higher per-capita GDP, a key but often overlooked difference is that 74% of U.S. GDP flows to household disposable income, compared to only 44% in China. What explains this disparity? As discussed earlier, a substantial portion of China’s policies and resource allocation is directed toward state-led and private-sector investment, effectively crowding out households. Consequently, Chinese households not only receive a smaller share of national income but also spend significantly less — just 30% of GDP, compared to 68% in the U.S.
As the world’s second-largest economy, China’s low household consumption is tightly linked to its chronic overinvestment and persistent trade surplus, which arises when domestic savings consistently exceed domestic consumption and investment. As shown in Figure 10, China recorded a trade surplus of $997 billion with the rest of the world, in stark contrast to the U.S. trade deficit of $1.2 trillion. This structural imbalance represents one of the fundamental challenges of globalization. If China were to reduce its investment share and significantly increase household consumption, it would promote a more balanced domestic economy and contribute to more sustainable global trade dynamics.
For example, if Chinese households were provided with greater disposable income, stronger social safety nets (such as retirement and healthcare support), and fewer barriers to buying foreign products, they would likely increase spending on both domestic and imported goods — including U.S.-made products. This shift in consumption would help reduce the U.S.-China trade imbalance, making tariffs less necessary as a tool of trade policy. However, economic policy in China as directed by the Third Plenum of 2024 contained no departure from past policies. The “two sessions” of 2025 added some measures to stimulate the economy without much redirection to domestic consumption demand.
The 2025 economic landscape, marked by unprecedented trade tensions and fiscal restructuring, represents a critical turning point for the U.S. and China. America's aggressive tariffs under the second Trump administration aim to reshape global trade but risk higher domestic prices, reduced consumer spending, and a potential recession. Meanwhile, China's continued reliance on exports, excessive investment, weak domestic consumption, and internal vulnerabilities deepen global economic imbalances. Although the U.S. faces near-term uncertainty and financial market volatility, it is expected to emerge without a deep recession through reshoring, investment, and technological innovation. In contrast, China faces deeper, long-lasting challenges. Suffice it to say, that it is difficult to predict the future structure of U.S./China economic relations. Nevertheless, there will clearly be more decoupling of the two economies.
在国泰银行赞助出版的《美中经济报告2022》中,加州大学洛杉矶分校安德森经济预测中心(预测中心)提供他们对美中这两大世界经济体的当前与未来的分析及观点。
逾65年以来,预测中心一直是分析美国和加州经济的领先的独立经济预测机构。年度报告及定期更新侧重于影响美中之间投资行为与资金流动的相关事件。
本报告中的预测性陈述,是来自预测中心根据当时可获得的资讯,对美国及中国当前及未来经济状况的分析及观点。这些预测乃考虑到业界趋势与其他因素所作出的,且包含了风险、变数与不确定性。此资讯以概述方式呈现,并未宣称资讯完整。本报告中的资讯不应被视为采取特定行动的意见或建议,且并不考虑任何特定业务目标、财务状况或需求。
在此提醒读者不要过度依赖前瞻性陈述。报告发表后,预测中心不负责公开发表对这些前瞻性陈述的任何修订结果。尽管已谨慎准备预测资讯,实际结果可能会有正面或负面的实质性差异。预测与假设范例可能因预测中心控制以外的不确定性与偶发事件受到影响。
Jerry Nickelsburg在2006年时加入加州大学洛杉矶分校的安德森管理学院及安德森预测中心。自2017年起出任安德森预测中心总监。他也在工商管理硕士课程中教授经济学,关注企业预测与亚洲经济。他拥有明尼苏达大学的经济博士学位,并曾就读于维吉尼亚军校以及乔治华盛顿大学。他在经济学与公共政策有关的言论获广泛发表及引用。
William Yu在2011年以经济学家的身份加入加州大学洛杉矶分校安德森预测中心。他在预测中心主要负责的领域包括经济建模、预测与洛杉矶经济。同时也从事中国经济以及其与美国经济的关系研究与预测。他的研究主轴包括诸如时间序列计量经济学、数据分析、股票、债券、房地产与商品价格动态、人力资本与创新等广泛的经济金融问题。