This year began with two significant events affecting U.S./China economic relations. First, the January 2020 outbreak of coronavirus (COVID19) interrupted China to U.S. supply chains with closed factories and extended holidays. It has now become a worldwide pandemic. To contain the crisis, quarantine and inspection measures have been put in place, many of which will affect the flow of goods and people between China and the U.S. for some time. Second, there was the Phase One trade agreement signing in which both China and the U.S. claim an increase in trade between the two countries would be forthcoming. These two countervailing forces define the current state of U.S./China economic relations. At present, the negative effects of the pandemic and associated U.S. recession are far outweighing the positive impact of the Phase One agreement, and that is expected to be the case throughout 2020.
With respect to the coronavirus outbreak, there is much uncertainty. It is possible that this is early in the life cycle of this pandemic, and that the peak has yet to be seen. At present, there are travel restrictions between many countries including China and the U.S., and many airlines have ceased or reduced trans-Pacific and domestic flights. In China, factory closings began in February, however, with the exception of Hubei Province, most are now expected to open by the end of March. In the U.S., entertainment and recreation venues are closed while performing arts and academics have been canceled into May. The normal work routine has been disrupted with the advent of widespread social distancing. To be sure, a fall-off of global tourism and transportation and the stalled production and consumption of goods and services is a blow to both the Chinese and U.S. economies. The UCLA Anderson Forecast is now predicting significant job loss with a U.S. recession that began this month. We continue to watch these developments, and as we collect more data in the following weeks, we will provide additional analysis.
On January 15, 2020, after 2-years of trade tensions between the U.S. and China, the two largest economies in the world signed a trade agreement. Although this is only the Phase One deal, the apparent breadth and depth in this 94-page document are beyond U.S. public expectations. The long-awaited trade agreement covers seven subjects: intellectual property, technology transfer, food and agricultural products, financial services, macroeconomic policies and exchange rates, expanding trade, and bilateral evaluation and dispute resolution. If China and the U.S. follow through on the agreement as the U.S. interprets it, this would mark a milestone for a less acrimonious and more sustainable economic relationship between the two.
However, if there were to be the perception in Washington that China was not living up to the agreement, then there could be a return to the trade war mode. There are many areas where there could be a disconnect between the two countries. One important one is in Articles 6.2.4 and 6.2.7 on expanding trade. These two sections require the U.S. to take affirmative action to make available goods that China wishes to purchase. Among these are launch services, satellites, computer chips, and electronic circuit boards, all items that have been blocked by the U.S. in the recent past. China is taking the position that if the U.S. denies them the purchase of goods that are designated as sensitive, that counts towards the total increased goods purchases as it represents a violation of U.S. obligations under Article 6.2 of the agreement.
A second is that China is appealing to free markets in the following sense: U.S. companies have to offer their products on a competitive basis to Chinese companies (Article 6.2.5). If a non-U.S. supplier offers a product at a lower price than the U.S. company, China is not going to force Chinese companies to purchase from the U.S. supplier, and China does not believe that would be a violation of the agreement. Think, for example, soybeans. If Brazilian farmers defend their newfound market in soybeans by lowering prices, and U.S. farmers do not follow suit, then China believes it is under no obligation under the agreement to purchase from U.S. farmers.
Third, China has been modifying its IP laws regularly. The agreement is silent as to whether future improvements along the same lines meet the terms or do not. Indeed, Article 1.34 and 1.35 are explicit in saying that both China and the U.S. will improve their IP protection where required by the agreement consistent with “its own system and practice,” and consistent with “promoting its high-quality growth.” One can read this as China continuing most of its current practice in pursuit of “Made in China 2025.” Finally, the disruption of the coronavirus outbreak will complicate China’s fulfillment of purchases of U.S. exports.
As we have mentioned in previous reports, the trade truce, as effective in easing trade tensions as it might be, will not stop the decoupling of the two rivals. Quite simply, they each have very different philosophies and potentially conflicting goals in technology, national security, and geopolitical engagement. For instance, on January 13, 2020, U.S. Secretary of State Pompeo in a speech to the Silicon Valley Leadership Group entitled “Technology and the China Security Challenge,” encouraged American companies to get rich doing business in China, but suggested that American companies should not do business that strengthens China’s military or aids in tightening the regime’s grip of repression. On the other side of the Pacific, China, in multiple articles in the Global Times, called Pompeo “despicable” for his remarks concerning China and the coronavirus, and the U.S. as “having a fondness for reckless unilateralism.” The South China Morning Post reports that Chinese Millennials are flexing their considerable spending power by shifting towards domestic brands; a fact, if it were to continue, that would make the Phase One deal more difficult to implement, and which would give more support to Beijing hardliners. None of this is made easier by the pandemic induced break in trade between the two countries.
In this report, we will do the following:
We focus more on the Phase One agreement in this essay as this is the better understood of the two, however, the pandemic will have a more pronounced and negative impact through the balance of 2020.
The consequence of the trade war of 2018/19 between the U.S. and China can be seen clearly in Figure 1, which displays the major exporters to the U.S. during 2018 and 2019. While most U.S. imports from other parts of the world have continued to increase, there was a significant decline in U.S. imports from China of about -16%. The E.U. has replaced China as the top trading partner in the volume of imports into the U.S. Imports from Vietnam increased by $18 billion (+36%) and from Taiwan increased by $8.5 billion (+19%) over the year. These two benefited from some manufacturers moving production out of China.
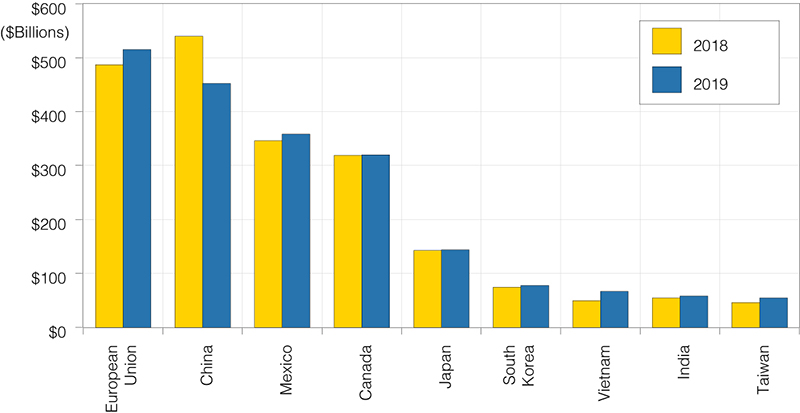
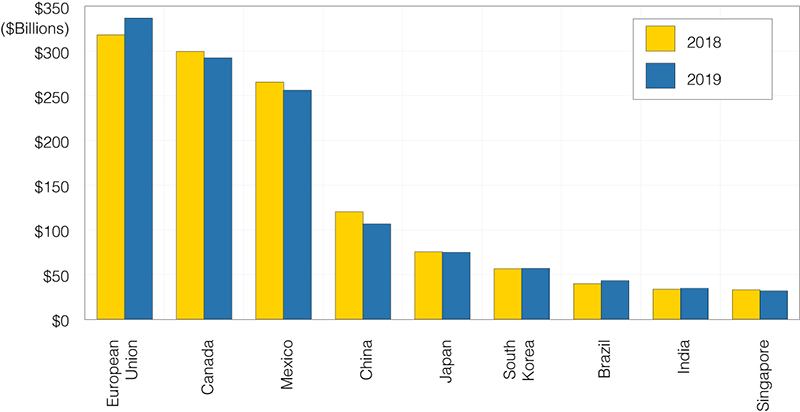
Figure 2 presents the major trading partners of the U.S. by exports. While China is the fourth largest country for U.S. goods exports, it has seen the largest decline (-$14 billion) over this period, more than Canada (-$7 billion) and Mexico (-$9 billion). In short, both the trade war with China and the strong dollar have hurt U.S. exports.
Since before the beginning of the trade war with the U.S., China’s policy has been to increase trade with other countries to replace those to the U.S. in the short run, and to reduce its dependence on exports in the long run. Figures 3 to 7 suggest that this policy has been somewhat successful, albeit with declining GDP growth rates. Figure 3 shows the seasonally adjusted monthly Chinese exports and imports with the rest of the world since the year 2000. The blue line is export value and the red line is import value. It is clear that Chinese export growth has been close to flat since 2014, and has not grown on average over the past two years. This shift away from an export-led economy to a domestic economy is explicit in China’s current five-year plan.
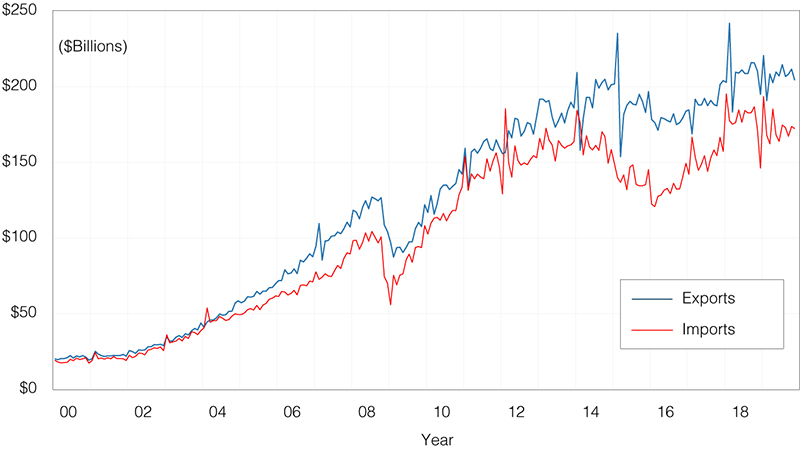
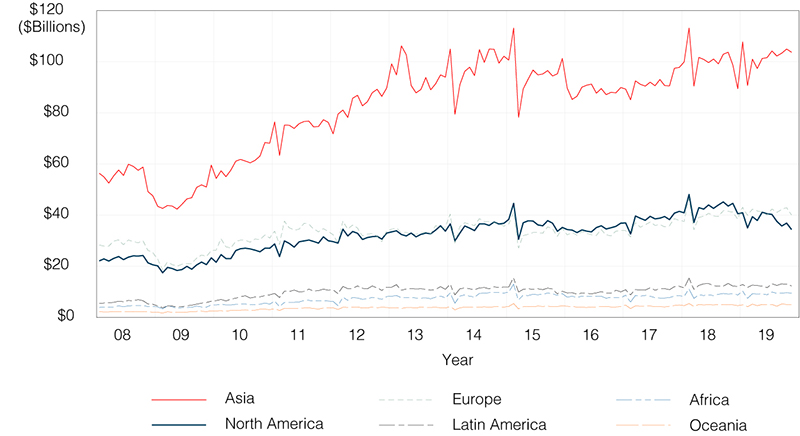
Figure 4 suggests China’s exports in 2019 to other Asia countries increased by a similar amount as its loss to the U.S. This could be for two reasons: (1) expansion into the rapidly growing Asia market augmented by the ambitious “One Belt One Road” initiative, and (2) “trans-shipment,” as a way to avoid U.S. tariffs. That is, Chinese exports shipped to a third country, and with or without further processing, garnering a changed label to “Made in the third country,” prior to its arrival on the U.S. shore. To the extent that this growth was for the Asian market and not trans-shipment, it met the diversification goal. To the extent that it was trans-shipment, the pandemic induced recession will reduce those flows through the current year.
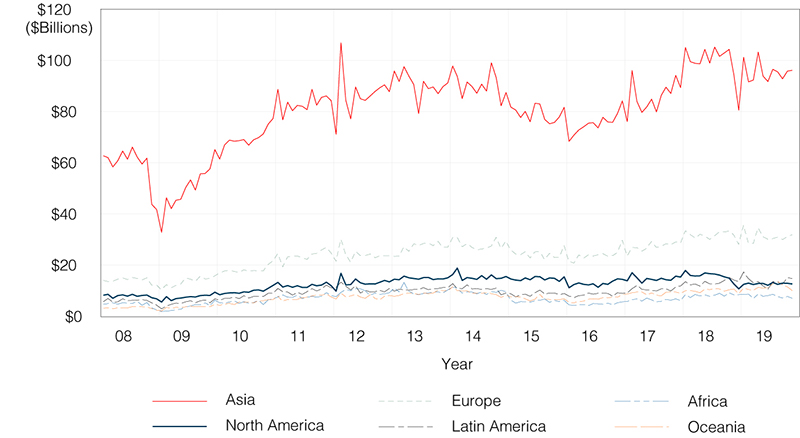
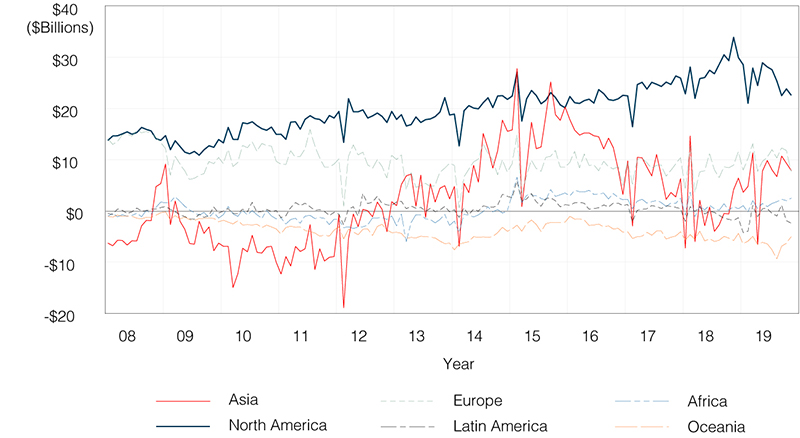
It is difficult for China to export more to the E.U. in the near term given the continued struggling European economy, as well as recent E.U. concerns about Chinese trade policy. Markets in Latin America, Africa, and Oceania are simply too small to make a difference (Figure 4). Given its size, Asia seems to be the only candidate for expanding Chinese exports to replace the North American market. However, the aggregate trade surplus that China has enjoyed (Figure 6) may be at risk. The real issue for China is whether or not the shift away from an export-led economy, accelerated first by the trade war and now by the recessions in the U.S. and Europe, will be too fast to avoid an even more pronounced slowdown in 2020.
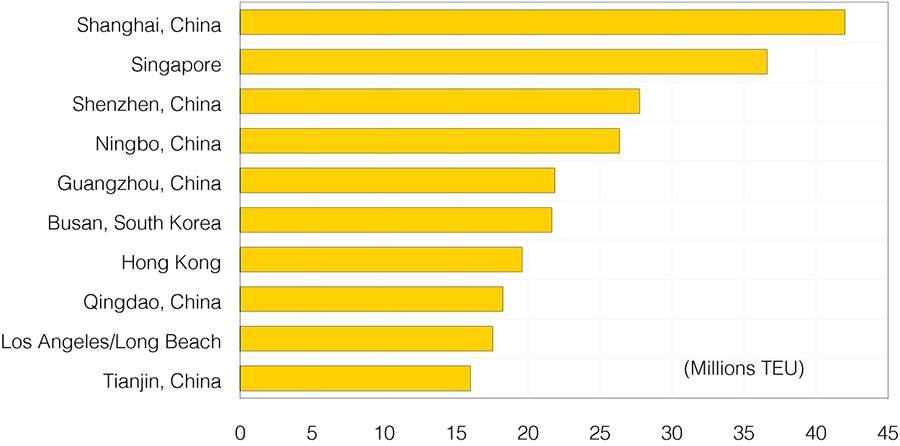
That said, it is almost impossible for either China or the U.S. to decouple on trade in the near-term without both suffering a further economic contraction due to the extent of the integration of the two economies. Maybe it is this revelation and realization that brought the two together to sign the Phase One deal. For better or for worse, China, with the support of U.S. manufacturers and retailers, has built an unprecedentedly large and efficient supply chain including supporting infrastructure in ports, roads, and railroads. For example, seven of the top 10 busiest container ports in the world are located in China and one, Ports of Los Angeles and Long Beach, is in Southern California (Figure 7). The ports in South East and South Asia have not been built out to handle the volume of freight coming out of China. Although the ports have been effectively idled of late, as the pandemic abates, expect activity at these seven ports to rebound.
First, let’s discuss the most controversial part of the Phase One Agreement: Chapter 6: Expanding Trade, in which China agrees to purchase an additional $200 billion of U.S. goods and services during 2020 and 2021 from a 2017 baseline. Figure 8 displays U.S. exports of goods and services to China in 2017, 2018, 2019 (estimated), and the values based on the agreement. China would need to purchase additional manufactured goods, including aircraft and vehicles, by $32.9 billion in 2020 (+44%), additional agricultural products by $12.5 billion (+53%), additional energy goods, including oil, natural gas, and coal, by $18.5 billion (+218%), and additional services, e.g., charges for use of IP, business travel/tourism, financial services/insurance, cloud/related services, by $12.8 billion (+23%).
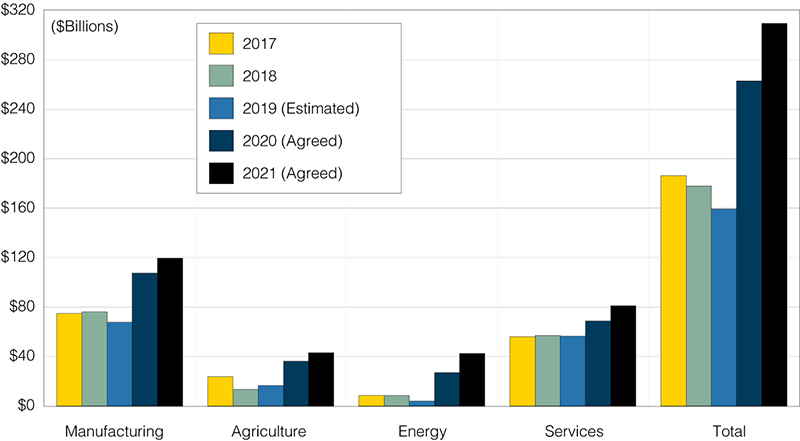
If this were to happen, U.S. exports to China will reach $263 billion in 2020 (+65%) and $310 billion in 2021. Needless to say, these are big increases. It is not certain that the U.S. can rapidly increase its production capacity and production in 2020 to meet the Chinese quotas. Indeed, there are some reasons to think that the increased purchases will not take place to the full extent, including the disruption of the coronavirus, and the increased export controls by the U.S. The former would represent a force majeure which, when it occurs, is a common out to a contractual agreement. For the latter, the Chinese have already said that if they cannot meet the quota because U.S. export controls deny them the purchase of those goods, then the quota will be non-binding. Add to this mix, the cessation of Boeing’s production of the 737 Max, and the Chinese requirement that U.S. suppliers sell equivalent quality at competitive world prices. All of these add up to the very real possibility of different interpretations of the agreement. Moreover, for aerospace purchases (aircraft, satellites, and launch services) orders for future delivery will count as current purchases. A typical large order for commercial aircraft stretches deliveries over many years into the future.
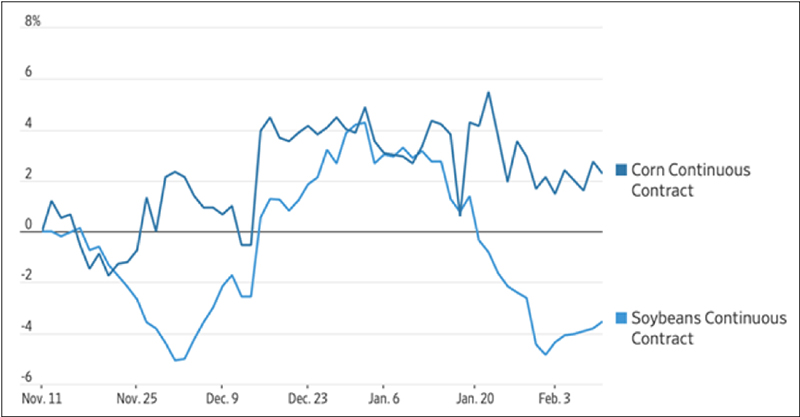
This is not just our thinking on the issue. The experts on demand and supply in commodity markets are the commodity futures traders themselves. Figure 9 shows the futures price changes for soybeans and corn. It is clear that those most in the know, and who stand to benefit or lose the most if they are wrong, are not thinking the Chinese purchase will happen or were it to happen, it would just represent a shifting of the cards in the commodity deck around the world without much economic impact.
The rest of the trade agreement consists of principles and details on intellectual property rights, technology transfer, and financial services. For example, in Section A of Chapter 1, it reads: “…China recognizes the importance of establishing and implementing a comprehensive legal system of IP protection and enforcement as it transforms from a major IP consumer to a major IP producer. China believes that enhancing IP protection and enforcement is in the interest of building an innovative country, growing innovation-driven enterprises, and promoting high-quality economic growth.” It is important to note, that while the U.S. administration is regarding this as a change in Chinese IP policy, it has been part of their policy for some time. Will there be a deviation from the trend towards tighter IP protection in China? This remains to be seen. However, the current trend may be sufficient to satisfy the agreement.
A crucial part of the success of this agreement is in Chapter 7: Bilateral evaluation and dispute resolution. Unlike the third-party arbitrage rule used by WTO, the ultimate deal makers and breakers are the U.S. Trade Representative and the Vice Premier of China. Recall the previous comments about the positions of the two countries. China views the U.S. as being “unilateralist,” and continues to state that, if it is not beneficial to both, the implementation of Phase One will not happen. The U.S. is insisting on unspecified metrics to be met in order to keep the deal in place. Thus, there is real uncertainty about the success and duration of Phase One.
The first wave of the direct impact of the coronavirus on the U.S. and China economies can be seen in China’s Purchasing Managers Index (PMI) from the National Bureau of Statistics of China. China’s non-manufacturing (services) PMI plunged to 29.6 in February from 54.1 in January. Above 50 means expansion while below 50 means contraction. China’s manufacturing PMI plummeted to 35.7 in February from 50 in January, the lowest level on record, even lower than the 38.8 in December 2008 at the height of the financial crisis.
Global supply chains, many of which are centered in China, are being disrupted and are being tested for their flexibility and resilience during this pandemic. This supply shock to the world economy, which is not only a China event, has important implications for the current business cycle. When firms are unable to obtain inputs to production, they will typically contract. Thus, the interruption in supply chains in the globalized world can well trigger a global recession by itself. The reduction in demand due to the need for populations to protect themselves from the pandemic creates the double punch that the world economy is currently experiencing.
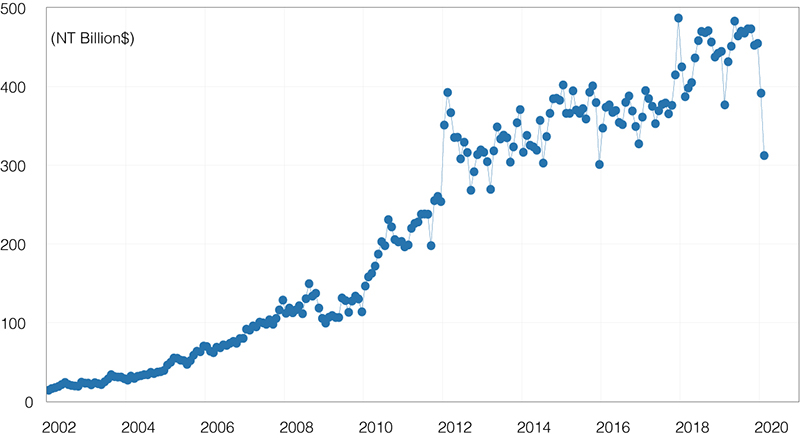
A prominent case of supply chain interruption is Foxconn, the primary manufacturer of Apple’s iPhone as well as many other electronic products. Figure 10 shows the seasonally adjusted revenue of Foxconn. As seen in the final part of the series, the year-over-year growth rate of revenue for February 2020 is -18%. As of March 3, Foxconn’s production resumption reached only 50% of its normal seasonal capacity utilization. With the recent reduced new cases of the disease, as published by the Chinese government, Foxconn announced that they expect to reach full seasonal capacity by the end of March. At the same time, Apple has announced that its first-quarter financial forecast will not be met due to the supply chain disruption and due to the reduced sales in the Chinese market.
Based on the latest release from China, its total export value declined by 17%, and its total import value declined by 4% for January and February 2020 compared to the same period in 2019. On the other side of the Pacific Ocean, the February 2020 year-over-year growth of cargo imports through the ports of Los Angeles and Long Beach declined by 20%, and exports increased by 5%. Since it takes around a month on average for a container ship to sail from China to Los Angeles, TEU growth will likely be negative in March as well. Therefore, even if normal production levels are achieved in China in April and the pandemic abates before June, the impact on U.S. manufacturers and retailers will likely last through the summer. However, “social distancing” and other pandemic induced behavioral changes create a demand shock that will induce lower trade levels through the rest of 2020.
The tourism and travel industry has been hard hit by the pandemic. Putting aside domestic tourism for the moment, global international tourism revenue was about $1.6 trillion in 2019 (1.9% of global GDP), and the U.S. share of this is approximately $260 billion. Given the current travel restrictions, voluntary closure of gathering spots, cancellation of flights, and caution in the U.S., China, Europe, and elsewhere, it is not surprising to see most of the tourism revenue evaporate. On a monthly loss basis, this is $132 billion for the world and $21 billion for the U.S.
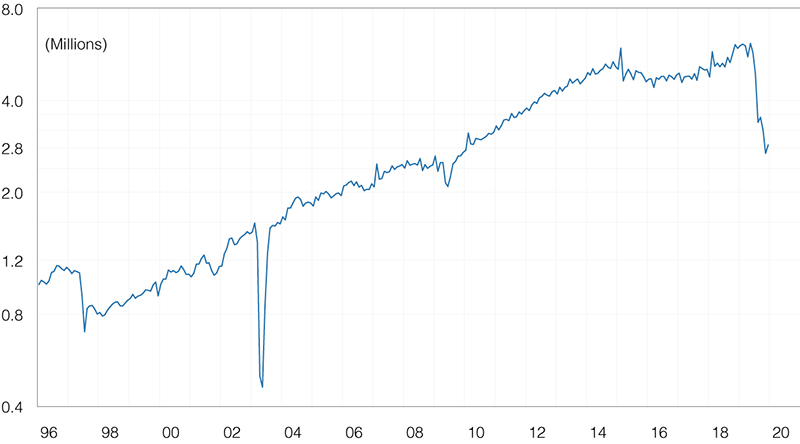
Figure 11 displays the monthly international tourist arrivals in Hong Kong from 1996 to the present. We can see during the SARS outbreak, March to June of 2003, Hong Kong tourism plummeted. When the outbreak ended, international tourists came back right away. The other large dip in tourist arrivals in Hong Kong was due to the recent protests in the city. Both events caused Hong Kong’s GDP growth rate to fall into negative territory as international tourism accounts for 11% of Hong Kong’s GDP.
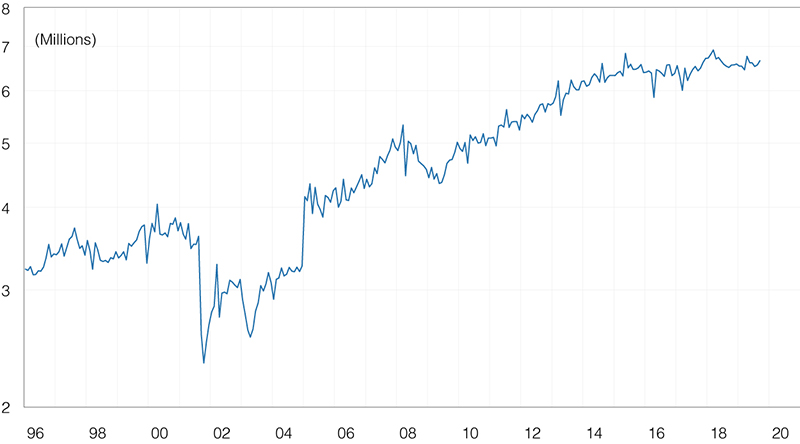
International tourism only accounts for 1.3% of U.S. GDP, and therefore, the total impact on the U.S. economy will be much smaller compared to more heavily tourist-dependent economies such as Hong Kong. But airlines, hotels and other tourism-related businesses will have a significant decline in demand for their services. Figure 12 presents monthly international tourist arrivals into the U.S. We see a similar plunge of international tourism in September 2001 due to the September 11 terrorist attack. Unlike a V-shaped recovery in Hong Kong in 2003, it took a while (U-shaped) to recover for the U.S. due in part because of other economic factors and travel restrictions at the time. However, similar to today, some airlines and tourism-related businesses failed during that period. Our expectation, given the uncertain run of the pandemic, is that the downturn will look like SARS and the recovery will be much more gradual and perhaps longer than the 9/11 recovery. This is, of course, speculative. The sense we have is that people will only slowly test the safety of large gatherings. There just won’t be an all-clear whistle indicating that there is no more COVID19 infection danger. This will be particularly true of large tours from China to the U.S. and vice-versa.
Although the Phase One deal has been a reset and has thus far prevented the U.S. and China from engaging in a full-blown trade war, the rapidly spreading COVID19 pandemic casts a long shadow over the recovery of normal trade between the two countries. Indeed, the global recession pushes the positive impact of Phase One out into 2021 at the earliest, and preoccupation with the pandemic will delay negotiations on a Phase Two deal for some time.
In addition to the pandemic and the fragility of the Phase One agreement, there remain many areas of economic tension between the two countries. For example, the U.S. government has asked its allies to not adopt Huawei 5G products over fears of potential spying. Huawei responded by taking steps to abandon its entire U.S. supply chain. More generally, China is trying to reduce its dependence on U.S. chips after the U.S. restricted American businesses from supplying key components to Chinese companies.
The disruption due to the pandemic may accelerate this decoupling. Other flash-points are: the recently opened U.S. investigation of the Chinese company ByteDance, owner of the social media video app TikTok, due to a concern about the collection of users’ personal data; the indictment of Huawei on racketeering charges; and the indictment of members of the Chinese military over a hacking breach at Equifax. Though the U.S. position on all of these is rooted in national security and privacy concerns, the potential restrictions on goods and services traded put the Phase One implementation at risk.
2020 will be a crucial year for both the U.S. and China. For the U.S., this is an election year, and the turbulence from the public health emergency and the recession in the economy will be the focus of Washington. For China, the early 2019 warning, “(to) be on guard against black swans and keep watchful for gray rhinos”1 was prescient. Navigating the restructuring of the Chinese economy while managing the course of the pandemic presents this very challenge, replete with concomitant domestic political overtones. Overlaid on this landscape is the aforementioned many-faceted strategic competition between the U.S. and China, as well as the restructuring of supply chains with likely near-term negative costs. Thus, there is very much heightened uncertainty with regards to U.S.-China economic relations for the coming 12 months; a time of both risk and opportunity.
Cathay Bank has established a sponsorship relationship with UCLA Anderson Forecast to produce a U.S.-China Economic Report. In this report, UCLA Anderson Forecast will talk about their view of economic analysis and perspective on the current and future outlook relating to the two largest economies in the world – the United States and China.
UCLA Anderson Forecast has been the leading independent economic forecast of both the U.S. and California economies for over 65 years. The annual report and quarterly columns written by UCLA Anderson Forecast will focus on current topics affecting investment flows and associated economic events between China and the United States.
This report includes forecasts, projections and other predictive statements that represent UCLA Anderson Forecast’s economic analysis and perspective on the current state and future outlook of the economies of The United States and China in light of currently available information. These forecasts are based on industry trends and other factors, and they involve risks, variables and uncertainties. This information is given in summary form and does not purport to be complete. Information in this report should not be considered as advice or a recommendation to you or your business in relation to taking a particular course of action and does not take into account your particular business objectives, financial situation or needs.
Readers are cautioned not to place undue reliance on the forward-looking statements in this report. UCLA Anderson Forecast does not undertake any obligation to publicly release the result of any revisions to these forward-looking statements to reflect the occurrence of unanticipated events or circumstances after the date of this report. While due care has been used in the preparation of forecast information, actual results may vary in a materially positive or negative manner. Forecasts and hypothetical examples are subject to uncertainty and contingencies outside UCLA Anderson Forecast’s control.
Jerry Nickelsburg joined the UCLA’s Anderson School of Management and The Anderson Forecast in 2006. Since 2017 he has been the Director of The Anderson Forecast. He teaches economics in the MBA program with a focus on Business Forecasting and on Asian economies. He has a Ph.D. in economics from the University of Minnesota and studied at The Virginia Military Institute and George Washington University. He is widely published and cited on issues related to economics and public policy.
William Yu joined the UCLA Anderson Forecast in 2011 as an economist. At Forecast he focuses on the economic modeling, forecasting and Los Angeles economy. He also conducts research and forecast on China’s economy, and its relationship with the US economy. His research interests include a wide range of economic and financial issues, such as time series econometrics, data analytics, stock, bond, real estate, and commodity price dynamics, human capital, and innovation.