At the 40-year anniversary mark of U.S.-China diplomatic ties, the relationship between these, the two largest economies in the world, is on the cusp of a transition from strategic engagement in the past to strategic competition in the future. The 2018 trade dispute between the U.S. and China are in 2019 only part of a competitive rivalry; one that includes domestic economic policy, technology, and geopolitics. In our past reports, we set out the reasons why negotiations between Beijing and Washington on trade issues would extend into this year, and indeed, this has occurred. But in the new larger context, some of the fundamental issues have become more difficult to resolve.
Weakness in the Chinese economy and potential internal dissention over strategy has led the Chinese back to the table. Pressure from the business community, including the U.S. Chamber of Commerce, hoping to avoid the proposed additional 25% tariffs on imports from China, has brought U.S. negotiators to the table. It is important to note, however, that progress in the negotiations has been focused more on increased openness for trade in goods and services than on the fundamental issues of intellectual property, cross-border investment, and geopolitics. It now seems likely that there will be a modest deal in the first half of 2019, and that this will prevent a further escalation of tariffs and non-tariff barriers to trade in the near-term.
Nevertheless, the expected trade agreement will not eliminate uncertainties between the two rivals as they each have very different philosophies and potentially conflicting goals with respect to technology, intellectual property, state-directed production, national security, and geopolitical engagement. To explore the expected relative position of the two countries as they grapple with these issues in the future, we examine the current outlook for the two economies through GDP performance, trade in goods, financial markets and investment in technology.
Superficially, the trade tensions of 2018 seem to have caused more harm to China’s economy than to the U.S. economy as measured by economic dislocation as a percentage of GDP. However, it is not clear if the political pressure to resolve the fundamental issues is stronger in China or in the U.S. as China’s exports to the U.S. have grown, while U.S. exports to China have declined.
The current consensus is that China’s official GDP growth in 2019 will be in the 6.0% to 6.5% range; the slowest in recent decades. Our forecast for the U.S. economy is for a slowing from 3% in 2018 to 2% in 2019. Forecasts for both countries assume a trade deal is achieved, and higher U.S. tariffs with the concomitant Chinese response do not occur. A risk to these forecasts is the absence of a deal, disruption in U.S. supply chains, idle capacity in Chinese factories, and volatility in global financial markets.
U.S. payroll job numbers in December 2018—plus 312,000—combined with wage growth, demonstrate that the U.S. economy is still in a good shape despite Wall Street jitters. The latest Duke University CFO Survey for the U.S., however, reflects a decline in optimism from an index of 68.6 in December 2017 to 66.4 in December 2018. This is consistent with the UCLA Anderson Forecast view of continued full employment and a return to a 2% long-run growth path. With the U.S. economy slowing, a significant disruption in manufacturing supply chains could well stop the current expansion in GDP.
By contrast, China continues to face mounting problems from local-government debts to real estate bubbles, and importantly, to the planned restructuring from an export-led economy as contemplated in the 3rd Plenum of the 19th Party Congress. The year-over-year growth rate of fixed investment subsided to 5.9%, the lowest level since 2000, and the official GDP growth rate remains in the mid 6% range. The Duke CFO survey for China tumbled from 75.2 to 53 during 2018.
The relative fragility of the Chinese economy can be observed in the manufacturing purchasing managers index (PMI). The red line (Figure 2) is the private sector PMI for China and the blue line is that for the U.S. A value above 50 predicts factory production is expanding while a value below 50 predicts contraction.
We can see some correlation between PMIs from both countries. Both dropped to below 50 in 2015 and surged back above 50 in 2016. In late 2017 and 2018, U.S. PMI was approximately 60 and China’s hovered around 51. In December, the U.S. PMI plunged significantly from 59.3 to 54.1 while China’s stumbled below 50.
Despite Chinese exports to the U.S. growing at a 10% rate (Figure 5), the trade disputes are giving pause to plans at China’s export-oriented factories. There is anecdotal evidence that manufacturing new orders, production, and decisions on investing and hiring are being delayed, and in some cases layoffs of workers are occurring. Although the current Chinese PMI is still higher than in 2015, some feel that the economic situation is similar to that during part of the 2008 financial crisis.1 How much of this is due to the trade tensions and how much to the reduced support for private versus state-owned enterprises is not clear. Nevertheless, the trade relations with the U.S. is surely having an impact.
Recessions are the way in which economies resolve imbalances between sectors. Given the vulnerability of China to disruptions in its export sectors, combined with the aforementioned issues in the Chinese economy, an economic contraction triggered by prohibitive tariffs with the U.S. might engender a prolonged recession. It is this, rather than the trade dispute itself that is causing concern in Beijing and that has infused new energy into the negotiations.
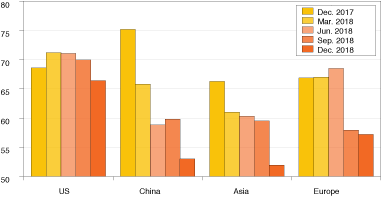
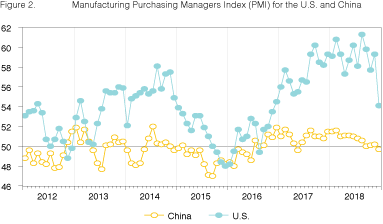
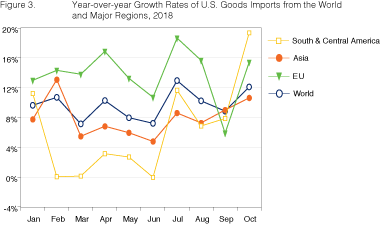
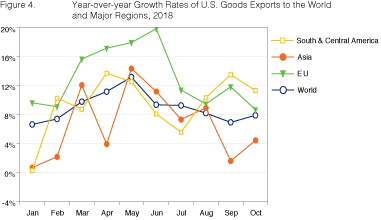
Figure 3 illustrates the year-over-year growth rate of U.S. imports from the world and from major regions over the first 10 months in 2018. Total world imports into the U.S. have increased by 10% over the previous year. Trade frictions and new tariffs between the U.S. and China and between the U.S. and other regions have not yet caused any decrease in aggregate U.S. imports, though clearly there have been individual products and sectors affected. Figure 4 illustrates the year-over-year growth rate of U.S. exports to the world and to other major regions. Compared to the previous year, total exports increased by almost 9%.
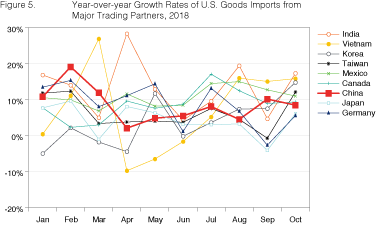
Figure 5 exhibits the year-over-year growth rate of U.S. imports from major trading partners in 2018. Imports from China are growing at a 8% rate, and there are no signs in the data of their abatement. It is interesting to see that since July imports from Vietnam have increased. There is anecdotal evidence that some manufacturing, particularly low wage manufacturing, has relocated from China amid rising labor costs and international trade frictions. Vietnam has emerged as an important destination for some of those manufacturers.
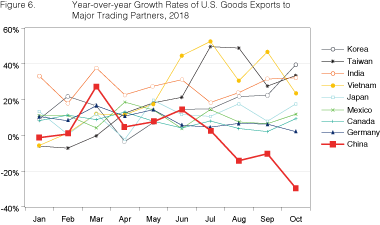
Figure 6 presents a picture of how tit-for-tat tariffs have reduced the direct exports from the U.S. to China. The year-over-year growth rate of these exports has collapsed from 14% in June to a negative -30% in October!
Current economic data showing a slowdown but not a collapse in China’s economic growth— a slowdown foretold prior to the trade dispute, increased Chinese exports to the U.S. and solid U.S. economic growth ought not to have caused investor concern in financial markets by themselves. However, recent developments in the trade dispute have created new concerns about the future within both countries. To examine this, we look at stock market performance in order to grasp the potential economic impact from a collapse in the current round of trade talks. Equity markets reflect investor expectations about the future value of companies whose shares are being sold. As such, changes in equity values provide valuable insight into the probability of increased trade tensions affecting the overall economy.
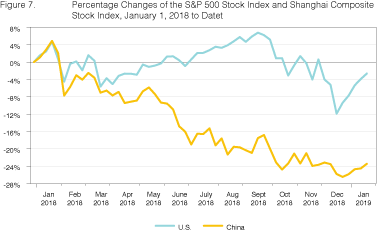
Figure 7 shows percentage changes in the S&P 500 index and in the Shanghai Composite index from January 1, 2018. It is important to note that these are not strictly comparable. Approximately one-third of the listings on the Shanghai exchange are state owned companies whose equities on the exchange represent only a minor portion of ownership and control. In April 2018, the total market capitalization for the New York Stock Exchange was around $23 trillion (119% of U.S. GDP) while the total market capitalization for the Shanghai Stock Exchange was approximately $5 trillion (42% of China’s GDP).
For the first three months the indices for both stock markets were in sync. Since March 2018, the beginning of trade tensions, China’s stock market has been in a slump. From January 2018 to January 2019, stock prices declined by 28% on the Shanghai Exchange. Not all of this slump can be traced to trade tensions with the US. Slowing growth in Europe, China’s largest market, capital controls, a stagnant housing market, and a shift in China’s economic policy all contribute as well.
During the same period, U.S. stock market prices declined by around 12%. A difference is expected as a larger portion of the U.S. economy is insulated from international trade than is in the Chinese economy. Since October, U.S. stock markets have suffered rapid setbacks (-18% for the S&P 500 index) purportedly due to nervousness with regard to U.S.-China economic relations. A simple explanation of the lag between the two may be in timing. The Chinese investor could well have incorporated knowledge of the Chinese negotiating tactics before the American investor did. At present both exchanges are incorporating a decrease in trade and investment. An example of the news generating these declines in equity valuations is Apple’s recent cut in its quarterly revenue forecast attributed to the slowing of its Chinese business2.
On October 4, 2018, Vice President Pence made a speech at the Hudson Institute, a conservative think-tank in Washington D.C., in which he reflected upon a growing distrust of China by the Trump Administration. He expressed frustration that, though America had hoped that economic liberalization would bring China into a more trustful partnership with the U.S., in his opinion, it has not. He suggested that China instead chose what he called “economic aggression.” By this he meant that China’s economic development policy set its sights on developing the most advanced industries and technologies, even at the expense of violating international standards. Whether a reader agrees or disagrees with Mr. Pence’s assessment, the Trump administration has adopted a new approach to China: one very much in line with those comments. Thus, U.S. economic and geopolitical policy is now being framed as a great power competition between the U.S. and China.
For some time, discussions within China have been framed in the same way; specifically, they have centered on the “Thucydides Trap” proposition that rising powers always challenge existing powers, and that this mostly results in a hot war between the two. Though Thucydides was referring to conflict between the city-states of Athens and Sparta in the 5th Century BCE, cold-wars and economic-wars might better characterize the “Trap” in the modern era. The debate in China has been whether such “wars” can be averted, either through economic and diplomatic channels, or not. The Pence remarks suggest that both sides are now viewing the dispute over trade in this more general context.
The ascendancy of China’s economy generating this wider rivalry required significant technological advancement. China’s acquisition of technology from abroad in pursuit of this goal is one of the major sources of tension. However, it is becoming increasingly difficult to discern what is domestically generated and what has been obtained from abroad as China’s push into technology has also been fueled by extensive research and development funding.
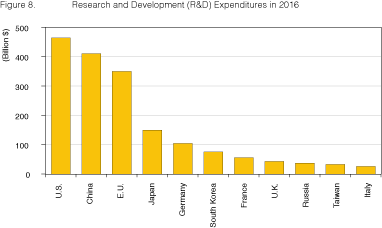
In 2016 (Figure 8) Chinese R&D reached $410 billion; surpassing that of the European Union, and approaching the $464 billion level of the U.S. Though the U.S.’s opposition to the “China 2025” plan would, if it were effective, scale this back, China is determined to continue bolstering its technology prowess through increased R&D in the future. As a consequence of both domestically generated and foreign obtained technology, China is making tremendous progress, and it is becoming increasingly competitive. This is evidenced by recent developments in 5G networks, ARJ21 regional jet production, and a landing on the dark side of the moon.
In 2018, “American First” clashed with the “the China Dream.” This clash is dominating U.S.-China economic relations in the early part of 2019 as well. Moreover, the economic dispute between the two countries is now being framed by tactics and strategy in the context of geopolitical rivalry. This suggests that at least some significant economic tensions will exist through the year and likely longer.
However, the pressures in the U.S. and in China have the two negotiating a new trade agreement at the time of this writing. Because the more significant and less tractable areas of dispute are not likely to be settled in the near term, a new agreement, if achieved in 2019, would be much more modest than the original goals of the parties.
But there is a risk. If the U.S. and China cannot come to an agreement at the end of the current round of negotiations, a possibility due to the new context of trade between the two countries, the U.S. may raise tariffs on $200 billion of Chinese exports. China will, of course, retaliate with tariff and non-tariff barriers to imports and investments by U.S. companies. Were this to significantly disrupt supply chains, then the manufacturing sector in China would be seriously impacted, and the U.S. might slip into a recession, and the two create what former U.S. Treasury Secretary Hank Paulson described as an “Economic Iron Curtain”.
Cathay Bank has established a sponsorship relationship with UCLA Anderson Forecast to produce a U.S.-China Economic Report. In this report, UCLA Anderson Forecast will talk about their view of economic analysis and perspective on the current and future outlook relating to the two largest economies in the world – the United States and China.
UCLA Anderson Forecast has been the leading independent economic forecast of both the U.S. and California economies for over 65 years. The annual report and quarterly columns written by UCLA Anderson Forecast will focus on current topics affecting investment flows and associated economic events between China and the United States.
This report includes forecasts, projections and other predictive statements that represent UCLA Anderson Forecast’s economic analysis and perspective on the current state and future outlook of the economies of The United States and China in light of currently available information. These forecasts are based on industry trends and other factors, and they involve risks, variables and uncertainties. This information is given in summary form and does not purport to be complete. Information in this report should not be considered as advice or a recommendation to you or your business in relation to taking a particular course of action and does not take into account your particular business objectives, financial situation or needs.
Readers are cautioned not to place undue reliance on the forward-looking statements in this report. UCLA Anderson Forecast does not undertake any obligation to publicly release the result of any revisions to these forward-looking statements to reflect the occurrence of unanticipated events or circumstances after the date of this report. While due care has been used in the preparation of forecast information, actual results may vary in a materially positive or negative manner. Forecasts and hypothetical examples are subject to uncertainty and contingencies outside UCLA Anderson Forecast’s control.
Jerry Nickelsburg joined the UCLA’s Anderson School of Management and The Anderson Forecast in 2006. Since 2017 he has been the Director of The Anderson Forecast. He teaches economics in the MBA program with a focus on Business Forecasting and on Asian economies. He has a Ph.D. in economics from the University of Minnesota and studied at The Virginia Military Institute and George Washington University. He is widely published and cited on issues related to economics and public policy.
William Yu joined the UCLA Anderson Forecast in 2011 as an economist. At Forecast he focuses on the economic modeling, forecasting and Los Angeles economy. He also conducts research and forecast on China’s economy, and its relationship with the US economy. His research interests include a wide range of economic and financial issues, such as time series econometrics, data analytics, stock, bond, real estate, and commodity price dynamics, human capital, and innovation.