For more than a year, the world has been disrupted by the COVID-19 pandemic. There have been more than 2.3 million deaths, and it induced a global recession. In addition, shortly after the January 2020 signing of the Phase One trade agreement, the outbreak in the U.S. and the rhetoric associated with it resulted in a deterioration of U.S./China relations. Today, after four-years of “America First” under President Trump, President Biden brings to the table a more nuanced and diplomatic style and tone. However, as we have suggested in previous reports, there will be no substantial change in U.S. policies toward China under the Biden Administration in the near-term.
President Biden and his cabinet members have positioned China as a strategic competitor and signaled they would continue some, if not all, of the Trump Administration’s hardline economic policies toward China. For example, Secretary of the Treasury Janet Yellen, during her confirmation hearing, said that, “… We have to play a better defense, which includes holding China accountable for its unfair and illegal practices and making sure that American technologies are not facilitating China’s military buildup … The Biden Administration will be willing to make use of the full array of tools to counter China’s abusive practices and hold Beijing accountable.”1 On Lunar New Year’s Eve, President Biden spoke with Chinese President Xi for the first time since taking office. Biden affirmed his priorities of protecting the American people’s security, prosperity, health, and way of life, and preserving free and open Indo-Pacific sea routes. Biden underscored his fundamental concerns about Beijing’s economic practices, the crackdown in Hong Kong, human rights abuses in Xinjiang, and the increasingly assertive actions toward Taiwan. Biden committed to pursuing practical, results-oriented engagements when it advances the interests of the American people and its allies.2
In this New Year’s Eve call, China repeated its usual talking points: promotion of world peace and stability, establishment of dialogues, and engagement in win-win cooperation. However, China also responded that the U.S. should respect China’s core interests and act prudently with respect to the issues of Taiwan, Hong Kong and Xinjiang because in Xi’s view these are Beijing’s internal affairs and concern China’s sovereignty and territorial integrity.3
These issues reveal a fundamental difference in the values of both sides and will make it more difficult to improve the relationship between the U.S. and China in the coming year. Nevertheless, we don’t see a further deterioration of U.S./China economic relations in the first year of the Biden presidency as both sides have internal economic and political problems as priorities for 2021. In summary, we predict the status quo for U.S./China economic relations for the balance of 2021 will be maintained. In this report, we review that status quo and what a new administration in Washington portends for the U.S. economy.
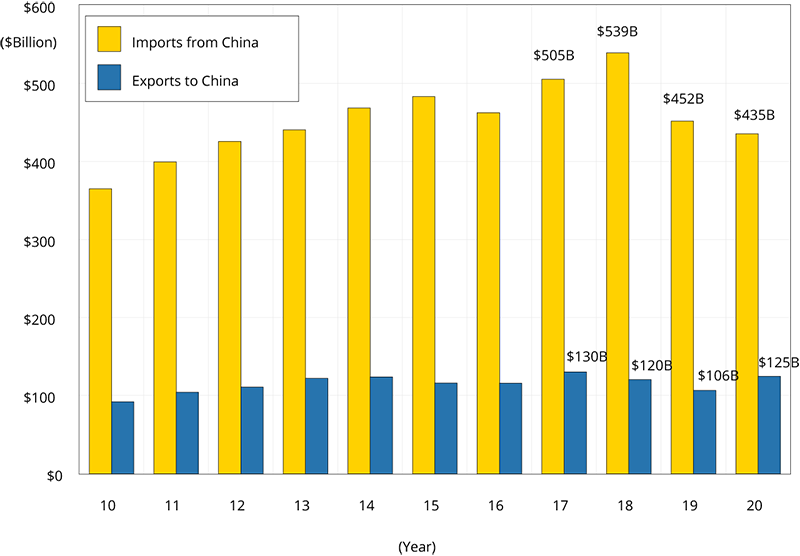
Figure 1 shows U.S. merchandise imports from China (yellow bar) and merchandise exports to China (blue bar). We can see that after the 2019 start of the U.S./China trade war there is a sharp decline in both imports and exports. In 2020, U.S. imports from China continued to decline but by a smaller amount (a $17 billion decline to $435 billion). At the same time, U.S. exports to China increased by $19 billion (from $106 billion to $125 billion). Although the export value in 2020 is still far lower than the target in the Phase I agreement, the trade deficit levels indicate a very slow speed decoupling of the two largest economies in the world. The U.S. dependence on imports from China, in terms of the U.S. deficit with China relative to the total U.S. deficit with the world, has fallen from a peak of 48% in 2018 to 34% in 2020.
The two most important factors impacting the U.S. economic outlook in 2021 are (1) the pandemic and associated public health policies and (2) the pandemic relief package. For purposes of our forecast, we are assuming that enough Americans will be vaccinated by the second half of 2021 such that the pandemic will have a much smaller economic impact. With the easing of public health restrictions on activity, the economic recovery will speed up. It is likely that Congress will pass a large fiscal support/stimulus package. While it might not be the proposed $1.9 trillion,4 it is likely to be the same order of magnitude.
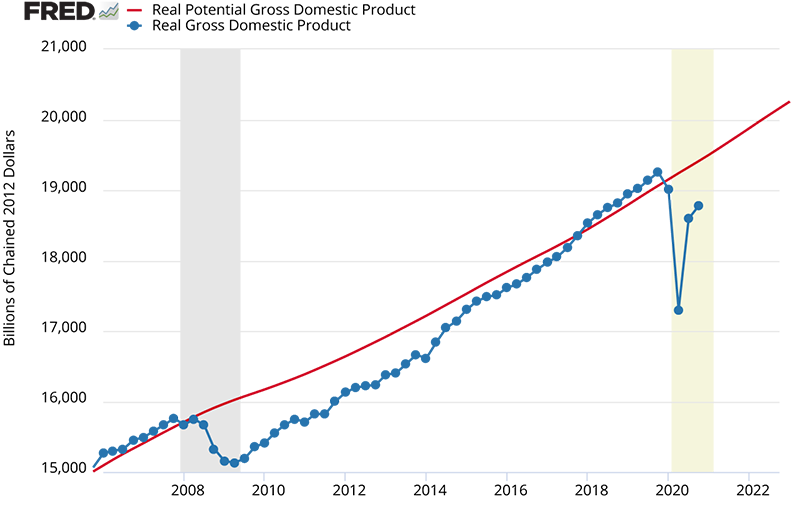
Proponents of a large support/stimulus package have argued that, in retrospect, the $800 billion American Recovery and Reinvestment Act of 2009 was too small to adequately stimulate the economy at that time. The evidence, they argue, is shown in Figure 2. After the recession, it took 10 years for the economy to grow back to the potential trend of 2% real U.S. GDP growth (red line). The Biden Administration has proposed to go big this time to support those who are hurt most by the current public health measures and to more rapidly push the economy back to the trend line after those measures are taken off.
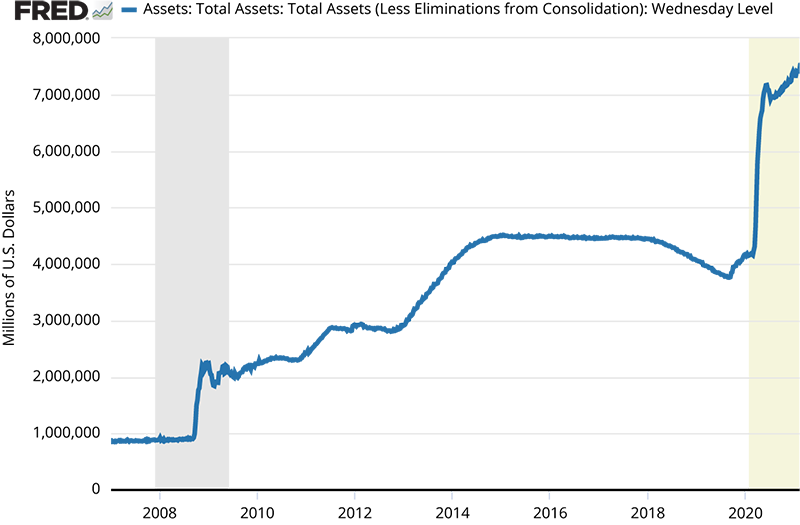
The Federal Reserve’s asset holdings skyrocketed from $4.2 trillion to $7.4 trillion in the months after the pandemic outbreak through aggressive open market purchases (Figure 3). At this moment, the Fed is buying $40 billion of Treasury bonds and $40 billion of mortgage backed securities each month.
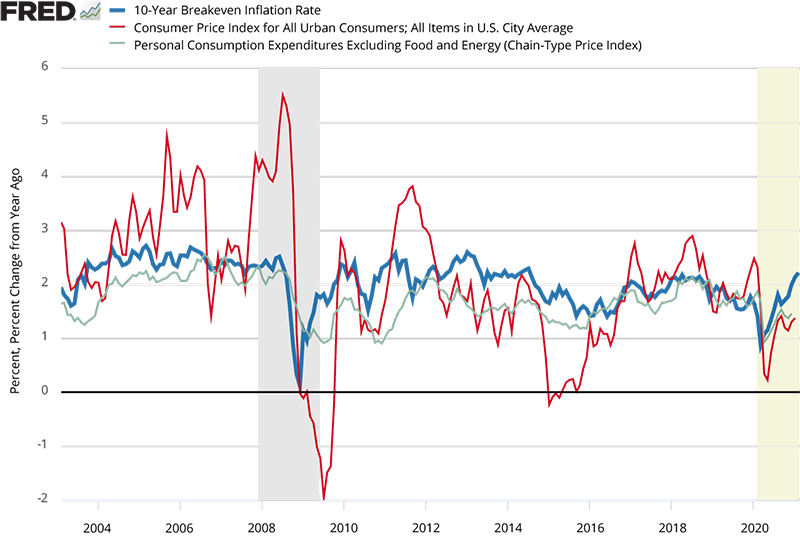
The direct consequence of the current large fiscal stimulus and aggressive monetary policy is a rising national debt and a ballooning Fed balance sheet. Macroeconomics is not able to answer the question of the relationship between these policies and inflation and asset bubbles in the future. Those advancing the argument that both monetary and fiscal policy should be significantly more moderate also made the same argument in 2009. Figure 4 shows the inflation expectation (via the 10-year breakeven inflation rate), headline inflation (via the consumer price index), and core inflation (via the consumer price index excluding food and energy). Inflation expectations by market participants is currently running around 2.2%. This is consistent with current Federal Reserve inflation policy and, in the period between 2013 to 2015, similar expectations did not presage an increase in inflation. While one should carefully monitor the data, the low inflation environment of the last decade provides evidence for our forecast of relatively low inflation in the next three years.
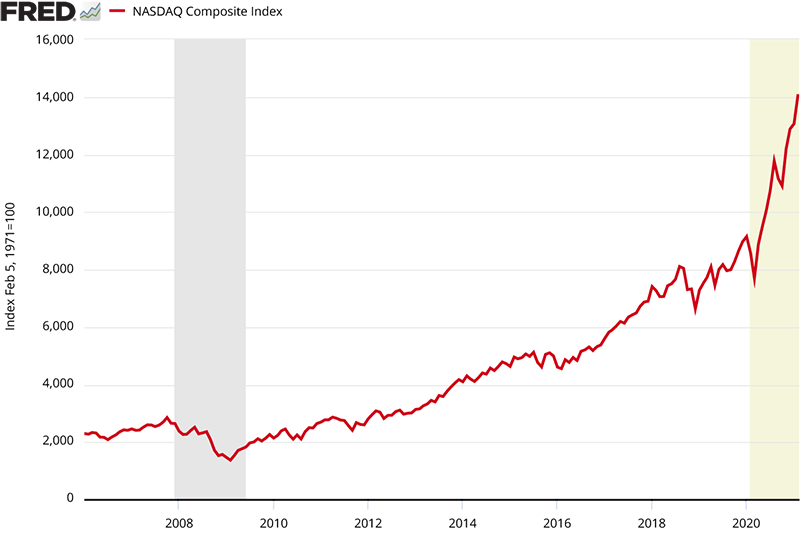
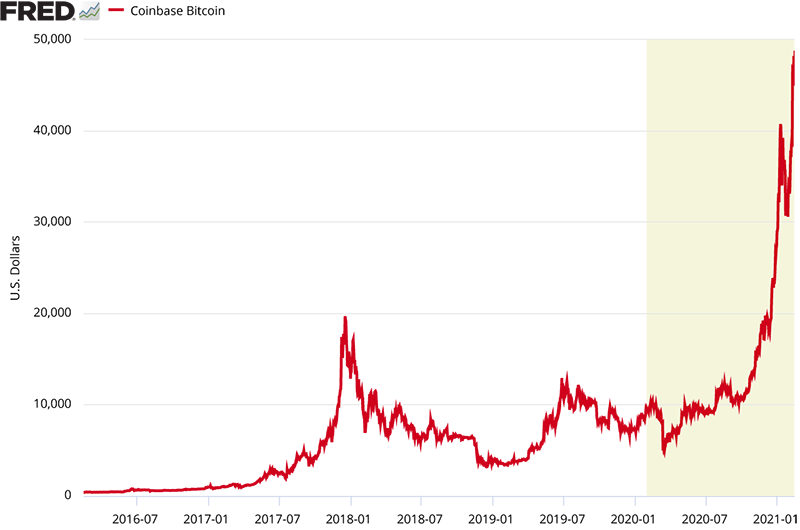
Though ample financial liquidity might not fuel consumer price inflation, it will land somewhere. The alternatives to consumption are investment and the purchase of assets. Figure 5 shows the Nasdaq composite index, which has grown by 44% from its pre-pandemic peak (from 9,750 in February 2020 to 14,075 in February 2021). Figure 6 shows the Bitcoin price which soared by 369% (from 10,400 in February 2020 to 48,700 in February 2021). For the Bitcoin market, there is an obvious asset bubble with mounting risks created by a pile of speculation money. For equity markets, it can be a function of low interest rates, the future prospects of companies coming out of the recession, particularly tech intensive companies, a flight to safety by foreign wealth holders, and an alternative to low interest money market instruments. Is this evidence of an asset price bubble? That is an open question. Recent speculation in equities such as GameStop should give us pause to consider that as part of the explanation.
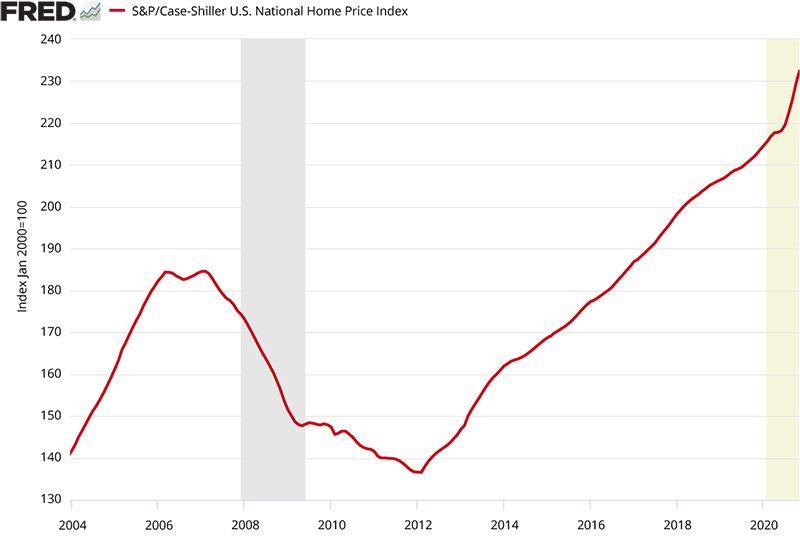
Housing markets are doing surprisingly well in the middle of the pandemic and the recession. Figure 7 illustrates that national home prices have risen by 8% over the past year. This is not the usual pattern in a recession. The first reason for the strength in the housing market is the historically low level of the 30-year mortgage rates, driven by the aforementioned Federal Reserve monetary policy. The second reason is that the pandemic has caused some renters living in the urban core to move and become homeowners in the suburbs. A third is that the recession has been disproportionately felt by lower income earners. Higher income earners have mostly kept their employment and are in a position to purchase a home. Though normally home price appreciation is either flat or negative in a recession, that is not always the case. Figure 8 displays year-over-year housing price index growth (all-transactions index by the Federal Housing Finance Agency) for the nation, and the states of California and New York. During the 2001 recession, home prices as a whole did not decline, but appreciated.
What is the explanation for this seemingly paradoxical movement in home prices? We suggest it was because in the early 1990s we had just come out a severe housing slump, particularly in California and New York. Consequently, there was not an excess of housing. Moreover, outside of the Bay Area, where home prices did in fact fall, the recession was a mild one. There was no excess lending or investment nor was there a housing bubble prior to 2001, and therefore there was no bubble burst in the 2001 recession. Though the current recession is much deeper than 2001, the recession for the part of the population who would be homeowners has also been quite mild. Moreover, like the buildup to 2001, there has not been an overbuilding of housing this time.
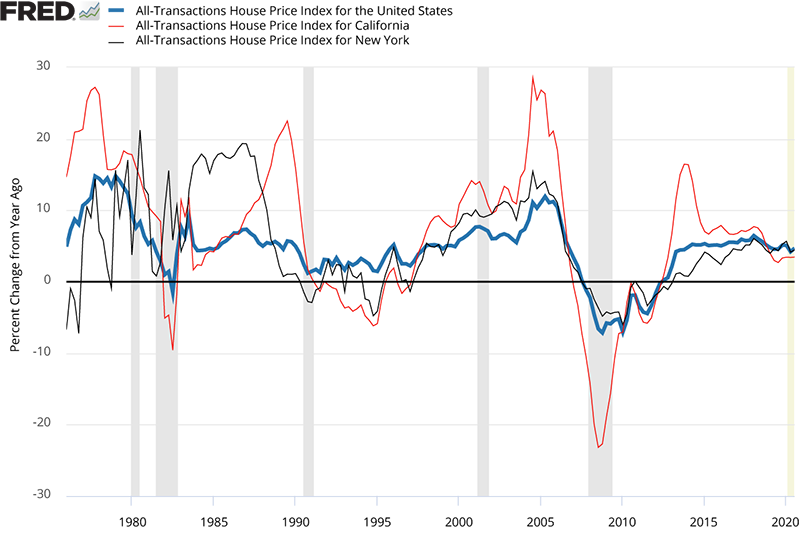
Figure 9 shows the growth rates for major metropolitan statistical areas of the Zillow mid-range housing value index and the Zillow rental rate index from December 2019 to December 2020. While average home prices are rising across the country (blue bars), rental rates (yellow bars) show a different picture. For the U.S., rental rates barely increased over the past year. New York, San Francisco, San Jose, Boston, Washington, D.C., and Seattle all had a decline of rents. The decline is largest in New York and San Francisco. This echoes the stories about tenants, who used to live in the urban core close to work and amenities, including restaurants, bars and theaters, having moved to suburbs and smaller cities in pursuit of lower density while remote work is offered and urban amenities are shut down.
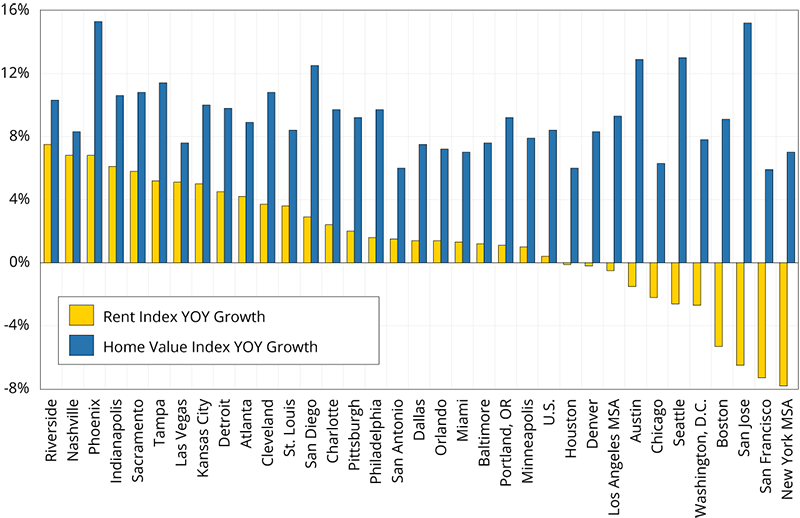
Figure 10 shows the correlation between the December 2020 Zillow estimate of rental rates for metros and the growth in rental rates from December 2019 to December 2020. There is a negative correlation between these two variables. High-rent metros have low and sometimes negative rental rate growth while low-rent metros have higher growth. To some degree, the pandemic and remote working have, at least for now, contributed to the converging of rents across the country.
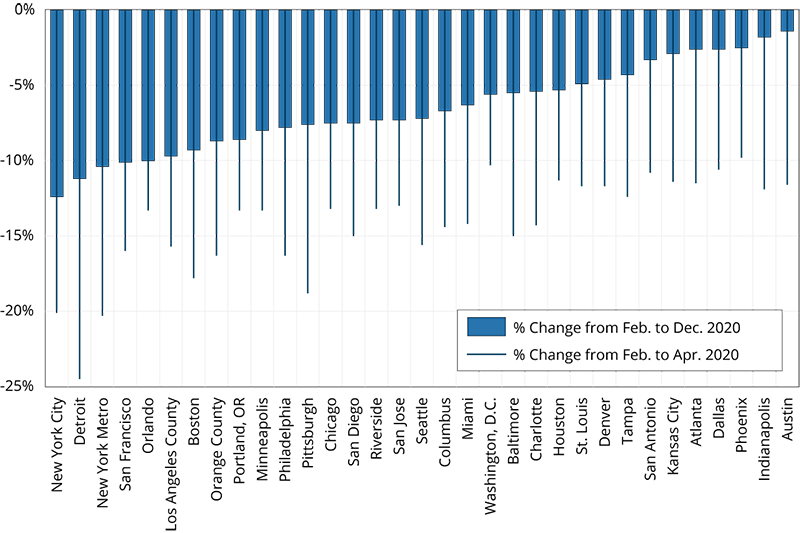
Declining rental rates in high-rent metros are also correlated with local job markets. Figure 11 shows the payroll job growth from February to December in 2020 by major metros. We can see that New York and San Francisco suffered the most job loss and the least job recovery. Some of the second-tier metros have had a faster recovery, such as Phoenix and Indianapolis. The employment recovery data is also an explanation for the housing and rental market performance as shown in Figure 9.
For commercial real estate markets, developers are pessimistic in retail and office space. Their caution will result in lower new supply over the next few years. For more details, see Allen Matkins/UCLA Anderson Forecast Survey in Winter 2021.5

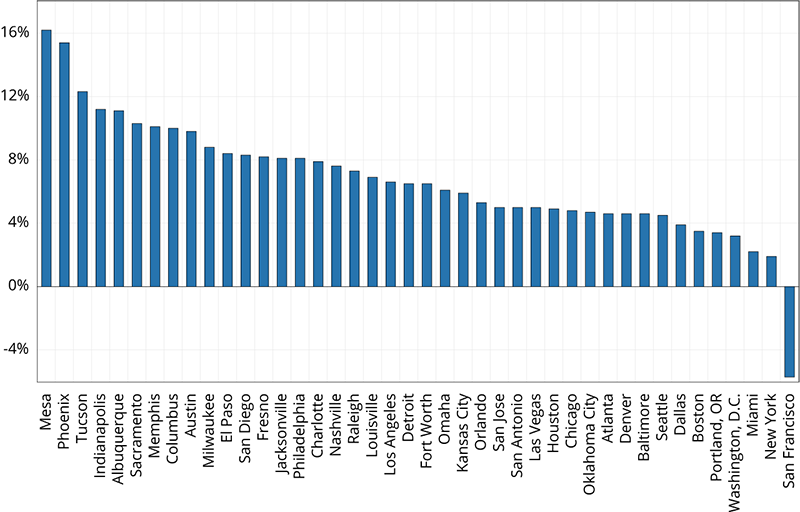
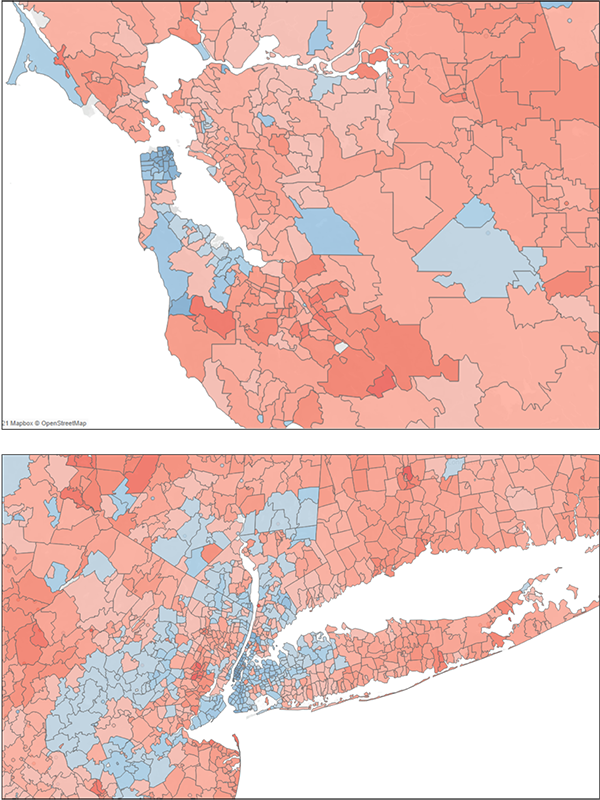
In the past two decades, two superstar cities, New York on the East Coast and San Francisco on the West Coast, became centers of global talent and wealth, attracting migration, investment and tourism. Consequently, they also became the most expensive places to live in the U.S. The COVID-19 pandemic hit these two superstar cities the hardest. Figure 12 shows the growth rate of the Zillow condo price index from December 2019 to December 2020 for major municipal cities.6 New York City has the lowest positive growth rate and the City of San Francisco had a negative growth rate during the pandemic. Figure 13 shows the growth rate of home prices by zip code in the New York and San Francisco metropolitan areas, with the blue coloration representing low or negative growth rates and red higher growth rates. We can see a clear pattern of dichotomy: urban center home prices decline, while in the suburbs prices increase.
An open question is: remote working has provided a proof of concept experiment, and do the results of that experiment mean that people and companies will come back to expensive urban cores in these superstar cities? Will superstar cities be super again? We suggest the answer is yes. The question is how long will it take? History tells us that prominent cities always come back. London has suffered many plagues during past several centuries, Tokyo suffered from earthquakes, fires and the WWII bombing devastation, San Francisco suffered the 1906 earthquake and fire and the 2001 dotcom bubble bust, and New York suffered the 9/11 terrorist attack and the 2008 financial meltdown. They all came back as dominant centers of economic activity. The price and rental adjustments we are seeing now in New York and San Francisco might in fact speed up the recovery as it will make these cities more affordable for young talent.
It is important to note that municipal governance is a crucial element for a city to succeed. People migrate to these and other cities for economic opportunities, amenities, and quality of life. If going forward, a city fails to provide for and maintain the quality of life, then it is more likely that temporary pandemic moves will translate into permanent moves.
The U.S. and China, two great powers and the largest world economies, continue to be in competition, particularly in the fields of geopolitical influence and technology. Though the U.S. has a new president, the competition has not changed. Indeed, the Biden Administration plans to build a global alliance in Asia to counter China. Over the past few months, Beijing reached an investment treaty with the European Union and signed the Regional Comprehensive Economic Partnership (RCEP) with members of the Association of Southeast Asian Nations plus South Korea, Japan, Australia and New Zealand. While there remains hope that issues such as climate change can be a common ground for both countries to engage and cooperate, these also could become new arenas of competition. Looking forward, we predict the U.S./China economic relationship in 2020 will remain as the status quo for 2021. The decoupling will continue, but supply chains are difficult to uncouple and therefore it will be at a relatively slow pace.
Once the COVID-19 pandemic abates sufficiently, the U.S. economy will experience robust growth. With plenty of liquidity and low rates, housing markets will continue their current trends through this year and into the next. Not only are the U.S. and China the largest economies in the world, but their growth prospects suggest that they will be among the most rapid growing economies as well.
In the U.S.-China 2021 Economic Report, sponsored by Cathay Bank, UCLA Anderson Forecast provides its view of economic analysis and perspective on the current and future outlook relating to the two largest economies in the world — the United States and China.
UCLA Anderson Forecast has been the leading independent economic forecast of both the U.S. and California economies for over 65 years. The annual report and periodic columns focus on current topics affecting investment flows and associated economic events between China and the United States.
This report includes forecasts, projections and other predictive statements that represent UCLA Anderson Forecast’s economic analysis and perspective on the current state and future outlook of the economies of The United States and China based on then available information. These forecasts take into account industry trends and other factors, and they involve risks, variables and uncertainties. This information is given in summary form and does not purport to be complete. Information contained in this report should not be considered advice or recommendation for a particular course of action and does not take into account any particular business objectives, financial situation or needs.
Readers are cautioned not to place undue reliance on the forward-looking statements. UCLA Anderson Forecast does not undertake any obligation to publicly release the result of any revisions to these forward-looking statements after the date of this report. While due care has been used in the preparation of the forecast information, actual results may vary in a materially positive or negative way. Forecasts and hypothetical examples are subject to uncertainty and contingencies beyond the control of UCLA Anderson Forecast.
Jerry Nickelsburg joined the UCLA’s Anderson School of Management and The Anderson Forecast in 2006. Since 2017 he has been the Director of The Anderson Forecast. He teaches economics in the MBA program with a focus on Business Forecasting and on Asian economies. He has a Ph.D. in economics from the University of Minnesota and studied at The Virginia Military Institute and George Washington University. He is widely published and cited on issues related to economics and public policy.
William Yu joined the UCLA Anderson Forecast in 2011 as an economist. At Forecast he focuses on the economic modeling, forecasting and Los Angeles economy. He also conducts research and forecast on China’s economy, and its relationship with the US economy. His research interests include a wide range of economic and financial issues, such as time series econometrics, data analytics, stock, bond, real estate, and commodity price dynamics, human capital, and innovation.